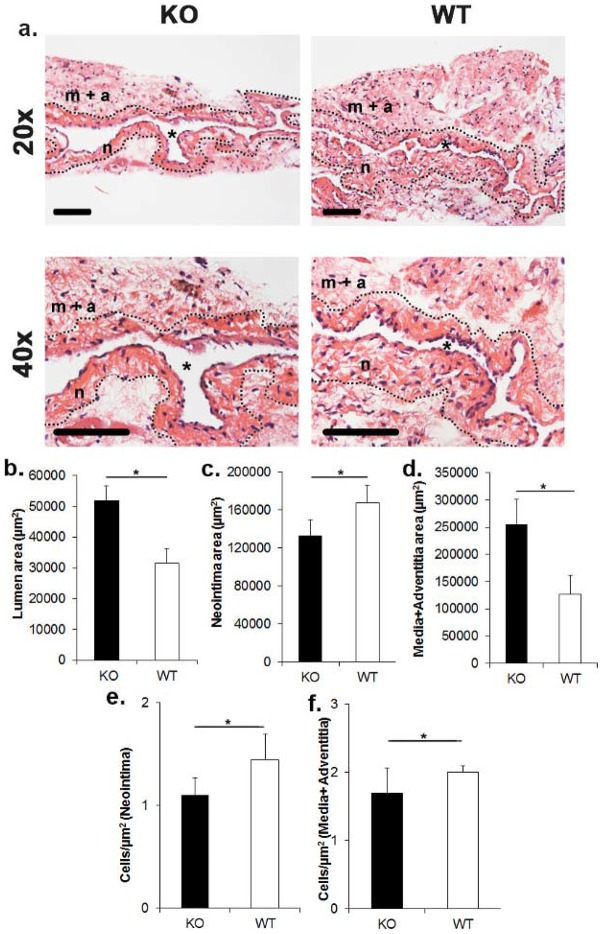
Figure 3. Hematoxylin and eosin staining with histomorphometric analysis of outflow vein removed from Iex-1−/− and WT animals at day 28 after fistula placement.
Representative hematoxylin and eosin staining of the outflow vein removed from Iex-1 KO and WT mice from 28 days after fistula placement Is shown in a. The neointima (n) is identified from the media and adventitia by the dotted line. m+a is the media and adventitia. * denotes vessel lumen. Top row is 20X and bottom row is 40X. Scale bar is 100-µms. Pooled data from the mean lumen vessel area from Iex-1 KO and WT animals are shown in b. There is a significant increase in the mean lumen vessel area in the Iex-1 KO animals when compared to WT controls (P<0.05). Pooled data from the mean neointima area from Iex-1 KO and WT animals are shown in c. There is a significant decrease in the mean area of the neointima in the Iex-1 KO animals when compared to WT controls (P<0.05). Pooled data from the mean area of the media and adventitia from Iex-1 KO and WT animals are shown in d. There is a significant increase in the mean area of the media and adventitia in the Iex-1 KO animals when compared to WT controls (P<0.05). Pooled data from the mean cell density in the neointima from Iex-1 KO and WT animals are shown in e. There is a significant decrease in the mean cell density of the neointima in the Iex-1 KO animals when compared to WT controls (P<0.05). Pooled data from the mean cell density in the media and adventitia from Iex-1 KO and WT animals are shown in f. There is a significant increase in the mean cell density of the media and adventitia in the Iex-1 KO animals when compared to WT controls (P<0.05). Student t-test with post hoc Bonferroni's correction was performed. Significant difference from control value is indicated by * P<0.05. Each bar shows mean ± SEM of 4-5 animals per group.

