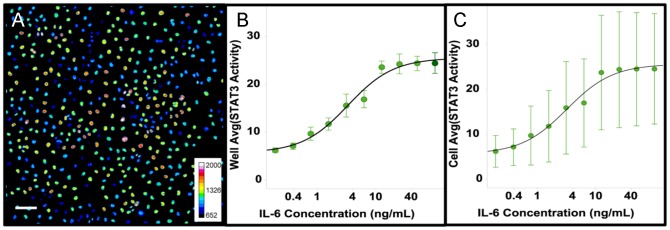
Figure 1. Heterogeneity in the activation STAT3 in Cal33 cells.

Cal33 cells were treated with IL-6 (50 ng/ml) for 15 min. then fixed and labeled with an antibody to phospho-STAT3-Y705. A) Pseudocolor image of STAT3 activation shows a high degree of heterogeneity in the intensity of the Cy5-labeled secondary antibody (color scale at lower right indicates mapping of relative fluorescent intensities to colors). Scale bar is 100 um (lower left). B) The standard deviation of the well average STAT3 activity in replicate wells (EC50 = 3.3 ng/ml, error bars are ±1σ, N = 8) indicates the assay is highly reproducible despite the observed cellular heterogeneity (Z’ = 0.54) C) The standard deviation of the cellular STAT3 activity (error bars are ±1σ) indicates the high variability in the cell-to-cell STAT3 Activity consistent with the appearance of the image (A).
