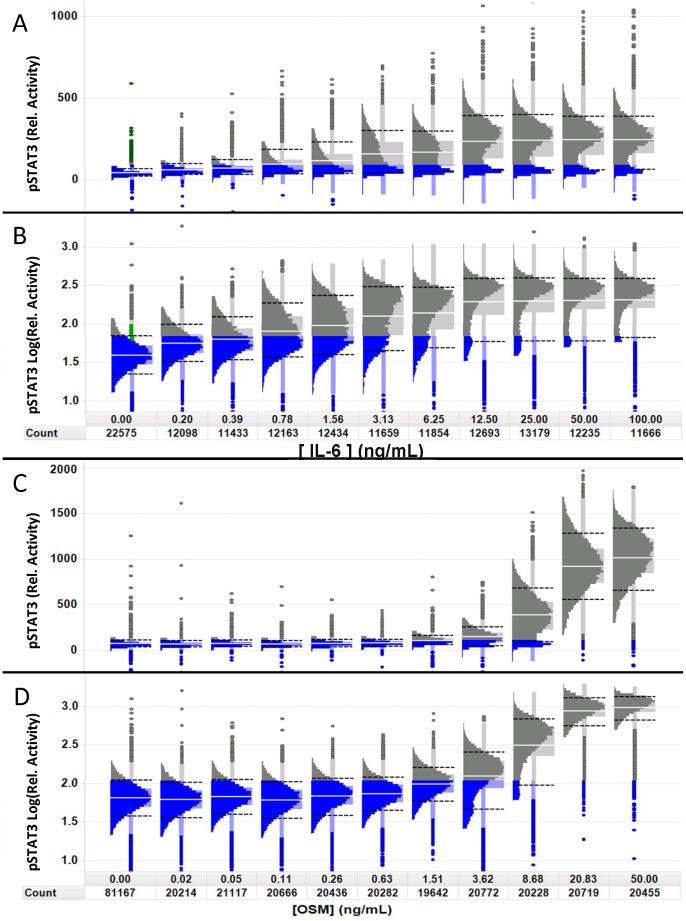
Figure 3. Visual analysis of phenotypic heterogeneity using the histo-box plot.
Population distributions of STAT3 activity in Cal33 cells at the peak induction time of 15th percentile of the untreated cells (left most histogram) are colored in blue to highlight the apparently non-responsive subpopulations. “Count” indicates the total number of cells measured. A) Linear-scaled dose-response distributions of STAT3 activity at the indicated concentrations of IL-6 show a persistent subpopulation of cells with a distribution comparable to the unstimulated cells. The well average EC50 = 3.3 ng/ml. B) Log-scaling of the same distributions in A shows that the CV of the responding cells (far right) is similar to the unstimulated cells (far left). C) Linear-scaled population distributions of STAT3 activation by OSM at the indicated concentrations also show a non-responding subpopulation at 8.68 ng/ml, but unlike IL-6 there are only a few outliers that are apparently non-responsive at 50 ng/ml and the responding cells appear to be more normally distributed. D) Log-scaling of the same distributions in C shows that the CV of the responding cells (far right) is similar to the unstimulated cells (far left).

