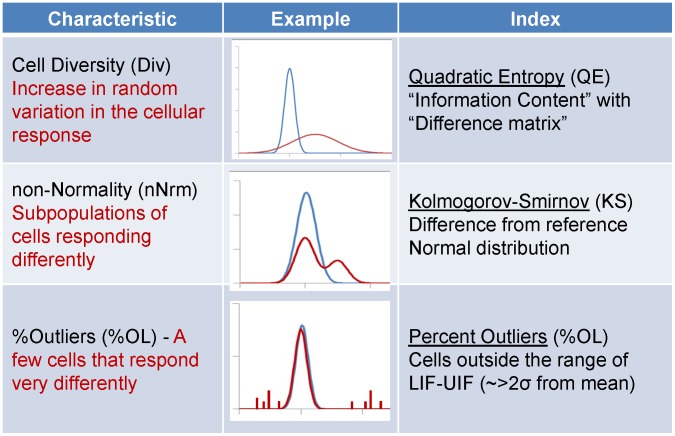
Figure 4. Three indices for characterizing cellular heterogeneity.
Three indices that provide information about the distribution were chosen. Cell Diversity (DIV) characterizes the overall heterogeneity in the population without regard for the specific shape of the distribution, using the Quadratic Entropy, a metric that is sensitive to the spread of the distribution as well as the magnitude of the differences between phenotypes in the distribution. Non-Normality (nNRM) indicates deviation from a normal distribution, distinguishing between micro- and macro-heterogeneity. %Outliers (%OL) indicates the fraction of cells that respond differently than the majority.

