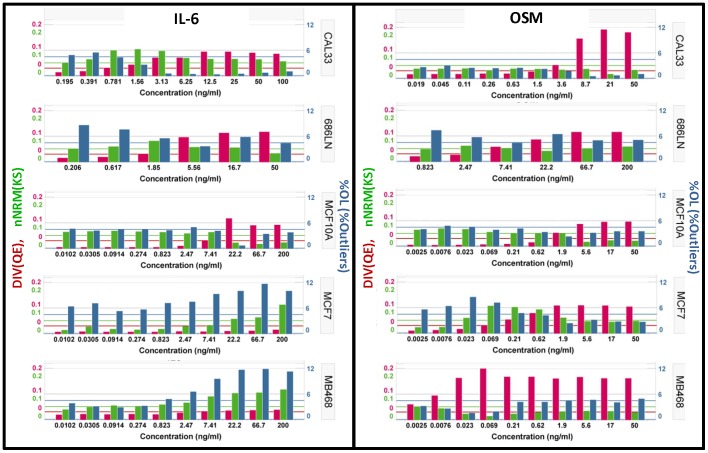
Figure 6. Comparison of the activation of STAT3 across 5 cell lines.
Application of the HI's to the data in Figure 2. Left Panel) Activation of pSTAT3 by exposure to IL-6 for 15 min at the indicated concentrations. Right Panel) Activation of pSTAT3 by exposure to Oncostatin M for 15 min at the indicated concentrations. Red Bars) Diversity index (DIV) indicating the relative heterogeneity associated with the activation of pSTAT3. The horizontal red line indicates the selected threshold for classifying populations a heterogeneous. Green Bars) The non-Normality index (nNRM) indicating the extent of deviation from a single, normally distributed population. The green horizontal line indicates the selected threshold for classifying a population as having macro-heterogeneity. Blue Bars) The percent outliers (%OL) indicates the percentage of cells with an activity level that is above the upper inner fence or below the lower inner fence. The horizontal blue line indicates the selected threshold that is used to classify a population as having more than the expected number of outliers.

