
Figure 3. Transmission electron micrographs of chloroplasts from leaves of rice.
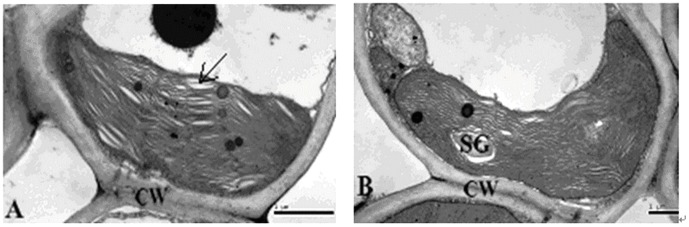
Scale bars = 1 µm. CW, cell wall; SG, starch grain. A: Chloroplast of a control plant grown without silicon fertilizer at the anthesis stage; B: Chloroplast of a silicon treated plant grown with slag (H) applied at a rate of 935 mg plant-available Si per kg soil at the anthesis stage.