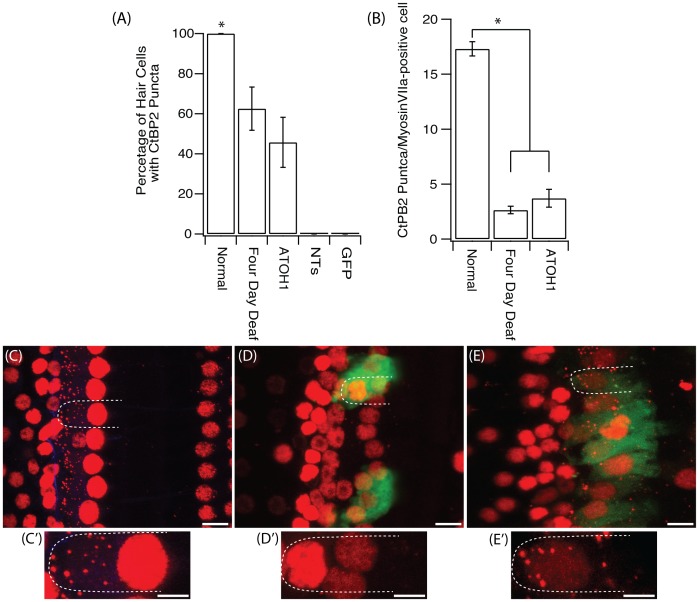
Figure 4. Fure 4. CtBP2 expression in IHCs.
(A) There was a significant decrease in the percentage of HCs that were positive for CtBP2 puncta after four days of deafness and after treatment with ATOH1 when compared to the normal hearing cochlea (*p<0.05, one way ANOVA). (B) There were also significantly less CtBP2 puncta per IHC after four days of deafness or ATOH1 treatment. Examples of CtBP2 staining (red) in the (C) normal, (D) GFP treated and (E) ATOH1 treated cochlea with their respective magnified image (C′-E′), green = GFP. Scale bar = 10 µm (main image) and 5 µm (magnified image)

