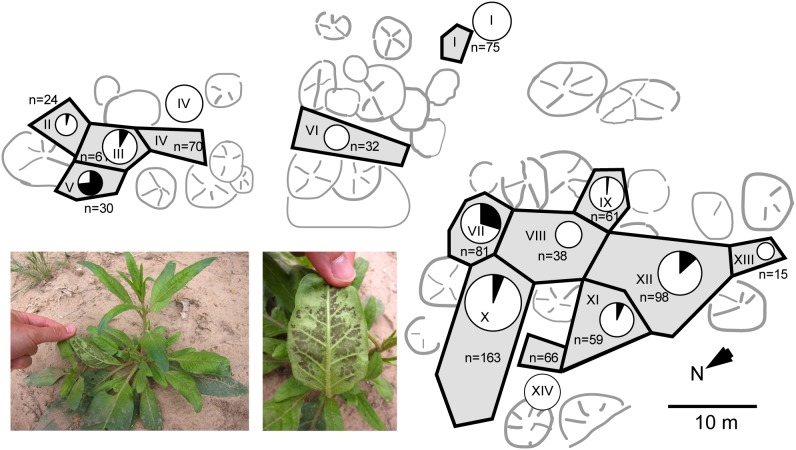
Figure 1. Schematic map illustrating the spatial distribution of diseased N. attenuata plants in a natural population.
The plant number (n) is indicated for each section of the population (labeled I to XIV). The area of the circles represents the number of plants in each section. The black fractions represent the percentage of diseased plants in each section surveyed on the second monitoring (June 9th 2011).

