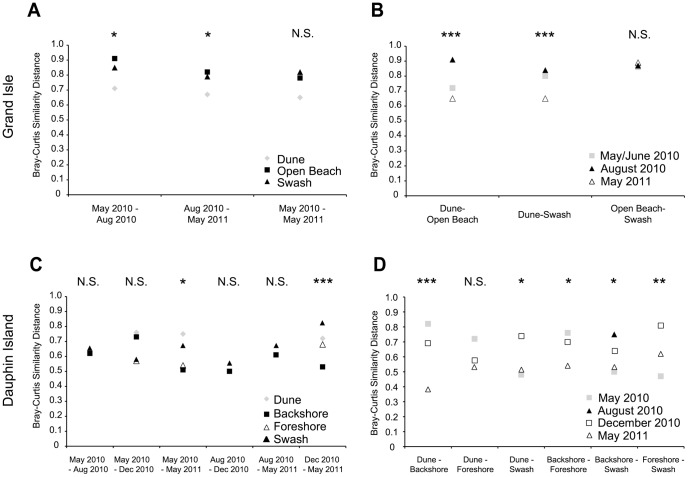
Figure 6. Bray-Curtis similarity distances among groups of samples for sampling times and beach locations.
For Grand Isle, comparisons are (A) between different sampling times and (B) between different locations along the beach profile, and for Dauphin Island comparisons are (C) between different sampling times and (D) between different locations along the beach profile. N.S. = comparisons were not significant. *weakly significant, between p-values 0.051 to 0.1; **significant, between 0.0001 to 0.05; ***highly significant, <0.0001.

