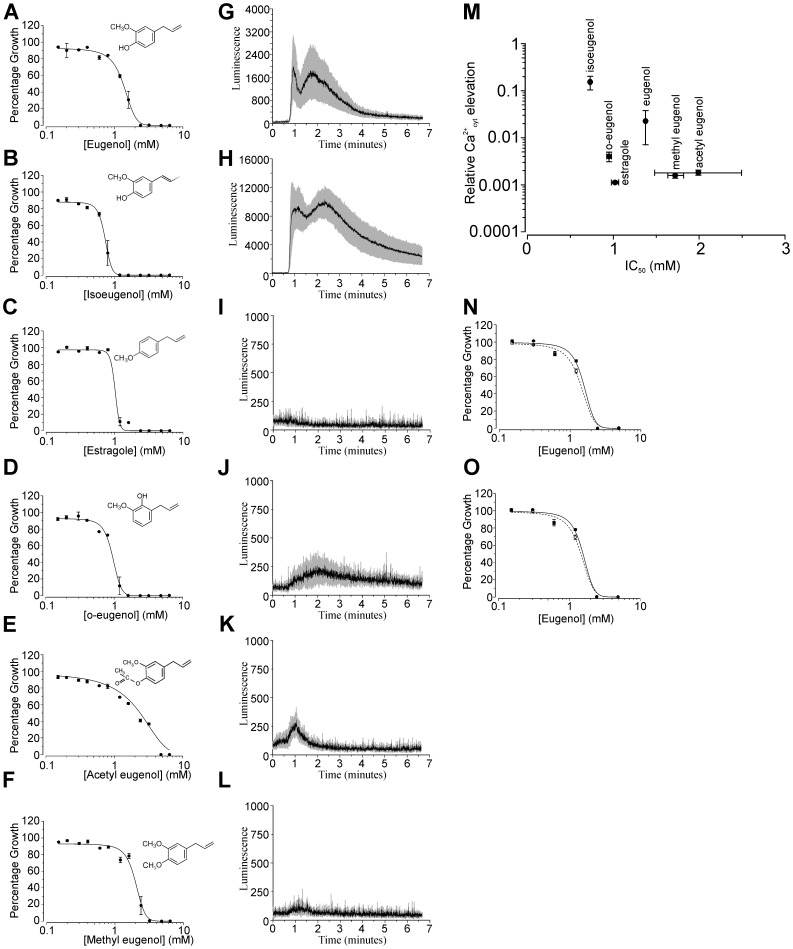
Figure 2. Eugenol toxicity is not dependent on Ca2+ influx.
(A - F) Jk9-3da growth in SCM-leu containing varying concentrations of eugenol (A) or eugenol derivative (B–F). Absorbance was recorded after 48 hours incubation and is shown as growth (absorbance) relative to growth exhibited in eugenol or eugenol derivative-free control media (SCM-leu containing 1% ethanol). Data are fitted with the dose-response function min + (max-min)/1+ ((x/IC50)−p)) where p is the slope, IC50 is the eugenol concentration inhibiting 50% growth and min and max represent minimum and maximum relative absorbance values respectively. Mean values (± SEM) from 4 experiments are shown. (G–L) Ca2+-dependent aequorin luminescence from Jk9-3da cell in response to addition of 3.2 mM eugenol (G), isoeugenol (H), estragole (I), o-eugenol (J), acetyl eugenol (K) and methyl eugenol (L) added at 40 seconds in SCM-leu. Traces represent mean (± SEM) from at least 4 independent experiments. SEM values are illustrated using grey shading. (M) plot of IC50 values (from data shown in parts A–F) against Ca2+ elevations (determined from data shown in parts G–L). Relative Ca2+ elevations were calculated as the sum of luminescence resulting from addition of eugenol or eugenol derivative divided by total luminescence determined after lysis with 1.6 M CaCl2, 20% ethanol (see Materials and Methods). N–O) Growth of BY4742 (parental strain; solid symbols and line) and pmc1Δ (N) and vcx1Δ (O) yeast mutants (open symbols and dashed line) in YPD containing varying concentrations of eugenol. Growth was recorded as detailed in parts A–F. IC50 values are 1.56±0.189 mM (BY4742), 1.45±0.112 mM (PMC1Δ) and 1.41±0.083 mM (VCX1Δ).

