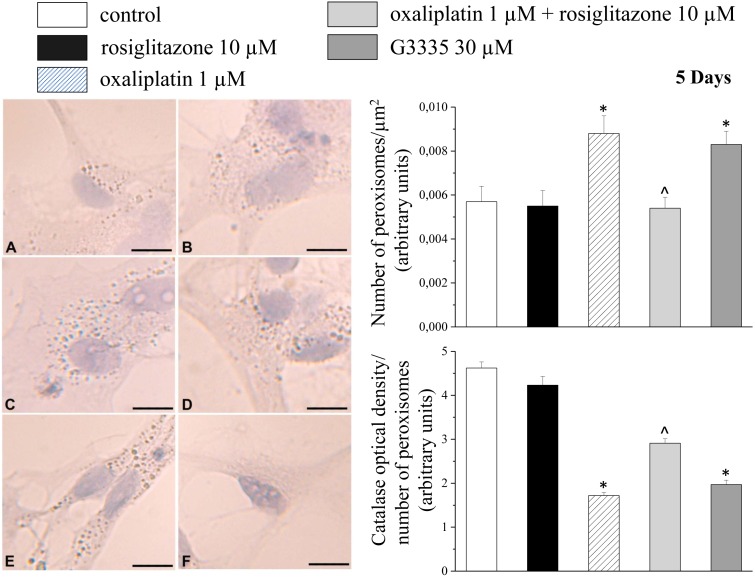
Figure 1. Catalase immunostaining in primary astrocytes.
Cells (5·104 cells/well) were incubated for 5 days with 10 µM rosiglitazone (B), 1 µM oxaliplatin (C), 1 µM oxaliplatin+10 µM rosiglitazone (D), 30 µM G3335 (E), negative control (F) in comparison to control condition (A). Representative images are shown in the left panel. Scale bar 50 µm. The measurements of the number of peroxisomes/µm2 and the catalase optical density per number of peroxisomes are shown in the upper and lower graphs, respectively. *P<0.01 vs control; ∧P<0.01 vs 1 µM oxaliplatin.

