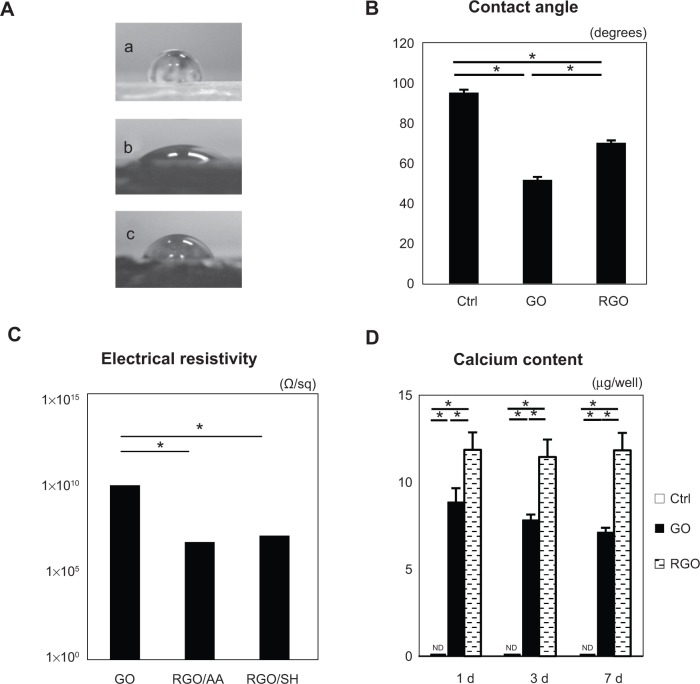
Figure 3.
Contact angle images (A) of culture dish (a); GO film (b); and GO film reduced by ascorbic acid (c). Summary of the contact angles (B) (N=6, means ± SD). Electrical resistivity measurements (C) (N=5, means ± SD) of the GO film (labeled “GO”); GO film reduced by ascorbic acid (labeled “RGO/AA”); and the GO film reduced by sodium hydrosulfite (labeled “RGO/SH”). (D) Calcium content of each film.
Note: *P<0.05.
Abbreviations: GO, graphene oxide; N, number of samples; SD, standard deviation; RGO, reduced graphene oxide; AA, ascorbic acid; SH, sodium hydrosulfite; Ctrl, control; d, days; ND, not detected.

