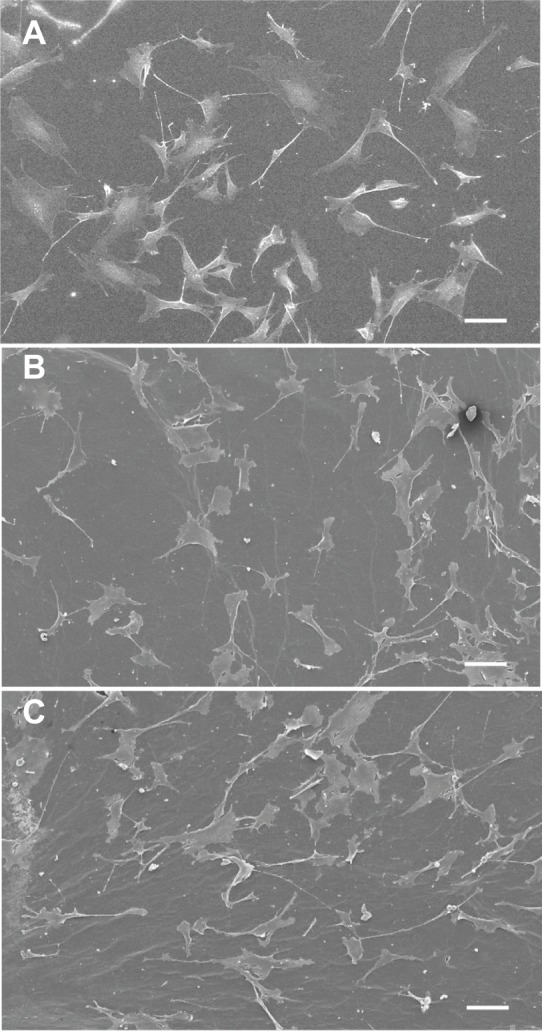
Figure 4.

SEM micrograph of cell morphology in a culture dish (A); GO film (B); and RGO film (C).
Note: Scale bars represent 100 μm in all three images.
Abbreviations: SEM, scanning electron microscopy; GO, graphene oxide; RGO, reduced graphene oxide.
