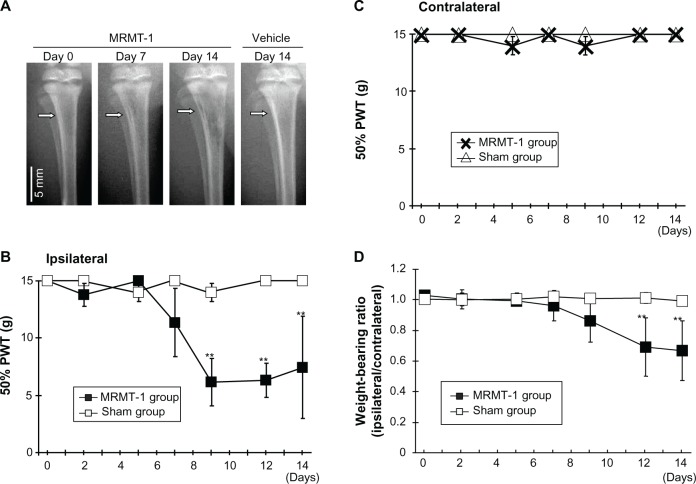
Figure 2.
(A) Radiographs of left tibiae inoculated with MRMT-1 breast cancer cells or vehicle. The white arrow indicates the MRMT-1 injection site. (B) Time course of the ipsilateral PWT to mechanical stimuli after intra-tibial inoculations of Hank’s buffered sterile saline (white box, n=6) and MRMT-1 cells (black box, n=6). These data are reported as means ± SD. **P<0.01 versus sham group. (C) Time course of the contralateral PWT to mechanical stimuli after intra-tibial inoculations of Hank’s buffered sterile saline (white triangle, n=6) and MRMT-1 cells (cross mark, n=6). These data are reported as means ± SD. **P<0.01 versus sham group. (D) Time course of the hind limb weight-bearing ratio (ipsilateral/contralateral) in rats that received intra-tibial inoculations of Hank’s buffered sterile saline (white box) (n=6) and MRMT-1 cells (black box) (n=6). These data are reported as means ± SD. **P<0.01 versus sham group.
Abbreviations: PWT, paw withdrawal threshold; SD, standard deviation.

