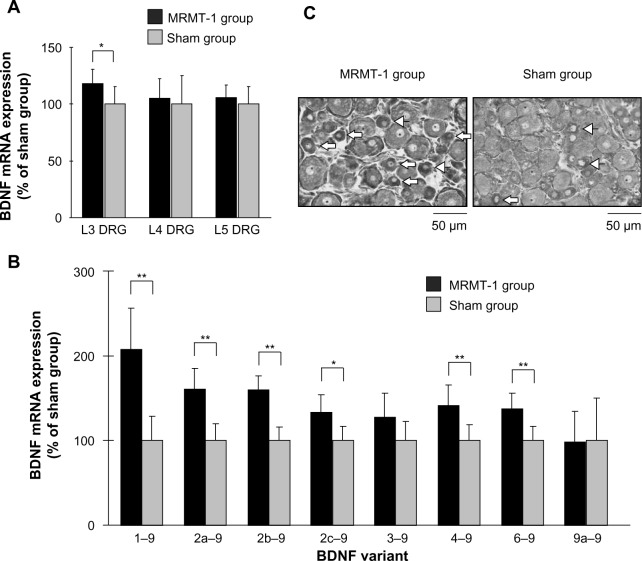
Figure 3.
(A) Relative expression of BDNF mRNA in the ipsilateral L3, L4, and L5 DRG 14 days after MRMT-1 inoculation. These data are shown as percentage to mean values of the sham group. Black bars and gray bars indicate the MRMT-1 groups (n=6) and sham groups (n=6), respectively. These data are reported as mean ± SD. *P<0.05, versus sham group. (B) Relative expression BDNF splice variants in the ipsilateral L3 DRG 14 days after MRMT-1 inoculation. These data are shown as percentage to mean values of the sham group. Black bars and gray bars indicate MRMT-1 groups (n=6) and sham groups (n=6), respectively. These data are reported as mean ± SD. *P<0.05, **P<0.01 versus sham group. (C) Photomicrographs showing the ipsilateral L3 DRG in the MRMT-1 group and sham group 14 days after surgery. Arrows indicate BDNF-positive small sized neurons (<20 μm), and arrowheads indicate BDNF-positive medium sized neurons (20–40 μm).
Abbreviations: BDNF, brain-derived neurotrophic factor; DRG, dorsal root ganglion; mRNA, messenger ribonucleic acid; SD, standard deviation.

