
Figure 4.
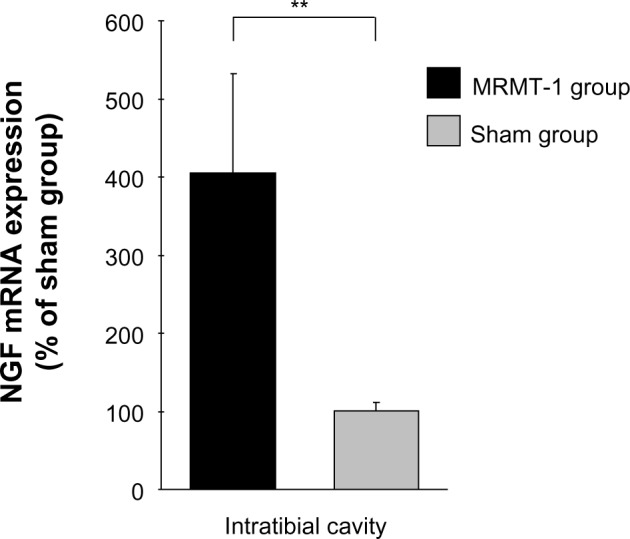
Relative expression of NGF mRNA in the intra-tibial bone marrow 14 days after MRMT-1 inoculation. These data are shown as percentage to mean values the sham group. Black bar and gray bar indicate MRMT-1 groups (n=4) and groups (n=4), respectively. Expression of each mRNA was normalized to expression of RPL27. These data are reported as mean ± SD. **P<0.01 versus sham group.
Abbreviations: NGF, nerve growth factor; mRNA, messenger ribonucleic SD, standard deviation.