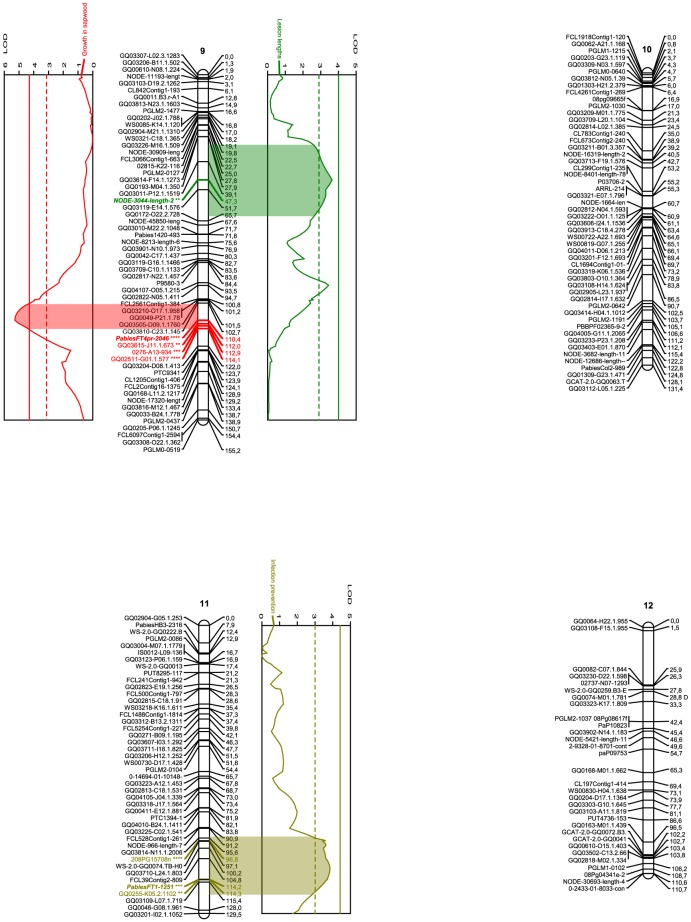
Figure 3. Linkage groups 9-12 of the Picea abies genome and the QTLs for various resistance traits.
Names of the SNP markers are displayed on the left of the linkage groups. Genetic distance (cM) is indicated on the right. SNP markers are described in detail in Table S1. Graphs denote QTL effects for the current group. Red curves indicate fungal growth within sapwood, green lesion length, and orange curves indicates infection prevention. Complete and dashed vertical lines describe 0.1% and 5% levels of significance for the individual trait and group. Wide colored areas between curve and group show the QTL confidence interval based on a 1 LOD drop from the QTL peak. The colored marker denotes SNPs under the QTL confidence interval, the stars level of significance according to the Kruskal-Wallis test (ranging from p<0.05 (**) to p<0.005 (****) and bold style the designated cofactors. “D” after a marker name indicates segregation pattern deviating from the expected Mendelian ratios of 1∶1 or 1∶2∶1 (0.005<P<0.05, χ2). Image created using MapChart 2.1 (Plant Research International). [28]

