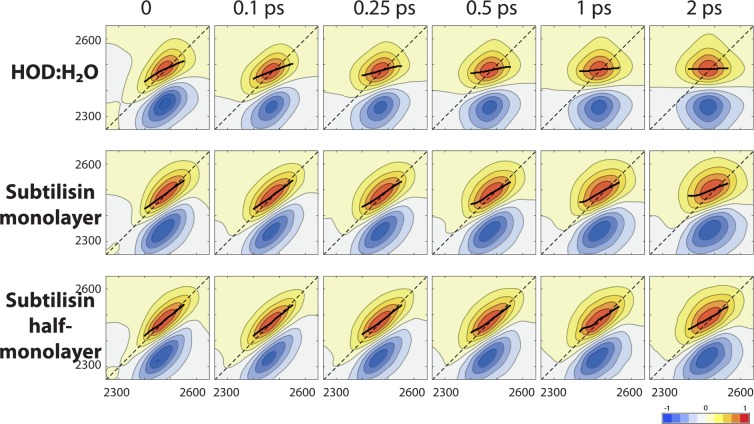
Figure 20.
Calculated 2D-IR spectra for the OD stretch of HOD in liquid H2O, respectively, in bulk water and in the hydration shell of subtilisin Carlsberg in hexane at different hydration levels, for waiting times ranging from 0 to 2 ps. The horizontal and vertical axes correspond to the excitation and detection frequencies, respectively, in cm–1. Each spectrum is normalized with respect to the positive peak height. The black lines show the center line slope80 on a 150 cm–1 wide interval centered on the positive peak.

