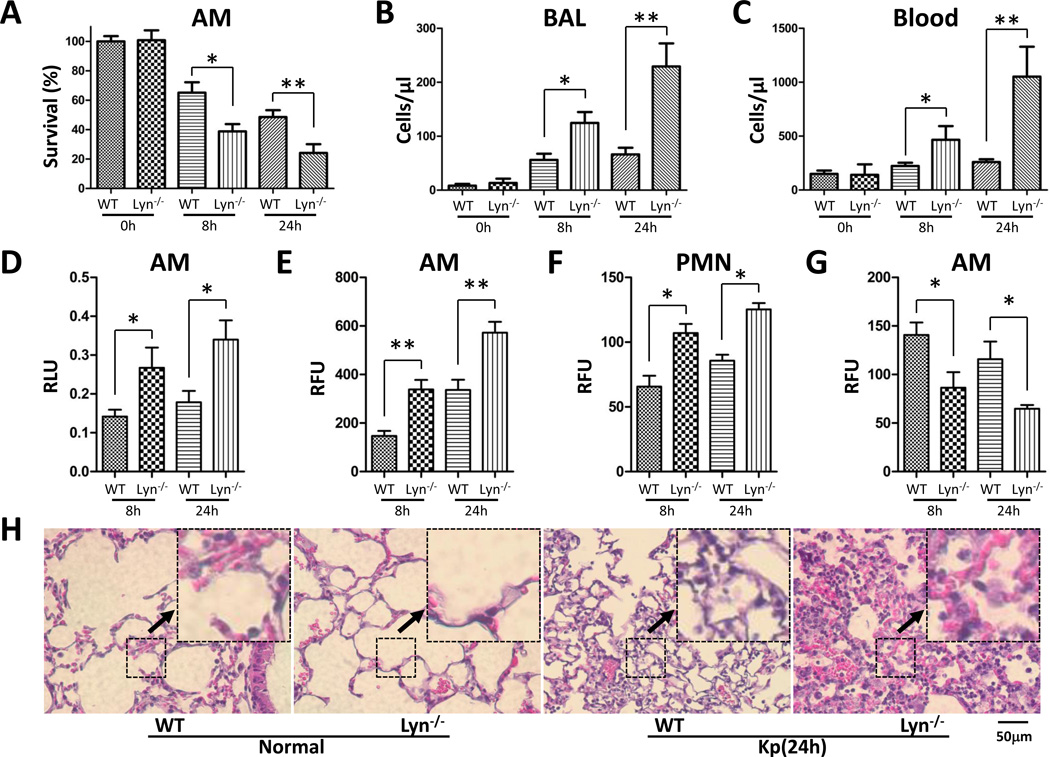
Figure 2. Increased PMN and oxidation injury in lyn−/− mice following Kp infection.
(A) Viability was determined in Alveolar macrophages (AM) by MTT assay. (B and C) PMN infiltration in the BAL and blood was counted by Hema staining. (D) Superoxide production in AM cells detected using NBT assay. (E and F) Oxidative stress in AM cells was determined by H2DCF assay. (G) Mitochondrial potential as assessed by the JC-1 fluorescence assay. (H) Lung injury as assessed by histological analysis (20×, scale bar=50 µm, inset shows the typical tissue injury and inflammatory influx). The data are representative of three independent experiments in triplicate. Mean+SEM; *, p<0.05; **, p<0.01; one-way ANOVA (Tukey’s post hoc). RLU, relative luciferase units; RFU, relative fluorescence units.

