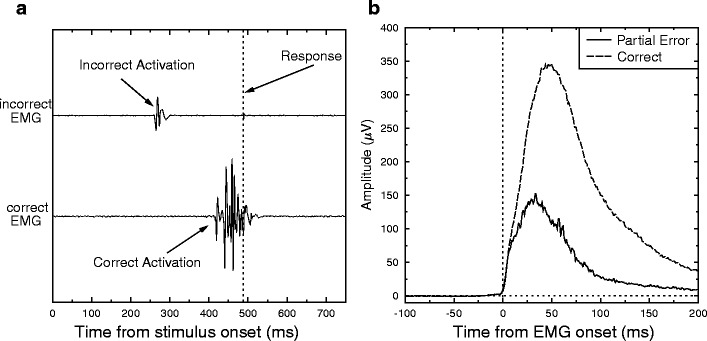
Fig. 1.

(a) Example of a partial-error trial. This graph presents the electromyographic (EMG) activity as a function of time poststimulus, in the muscles involved in the execution of the incorrect (top) and correct (bottom) responses. Time 0 corresponds to stimulus presentation. The vertical black dashed line indicates the mechanical response. Although the correct response was given, one can clearly see EMG activity in the muscle indicating activation of the incorrect response. This activation is, however, too low to trigger an overt error. (b) Grand averages of the rectified EMG activity for partial errors (solid line) and correct responses to pure-correct trials (dashed line)
