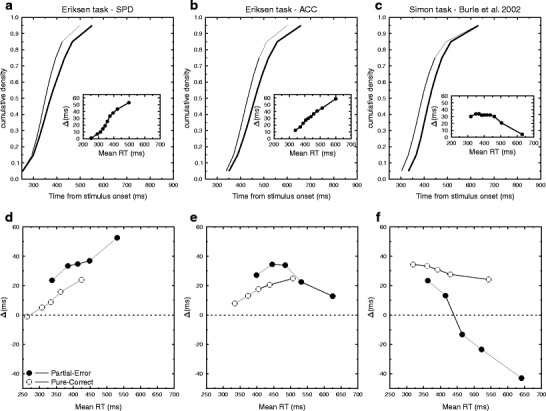
Fig. 2.

Distributions analysis for the present data and comparison with Simon data. (a–c) Cumulative density functions and associated delta plots (insets) for the whole distributions of correct RTs, for the SPD and ACC conditions and a Simon task, respectively. The thin lines indicate compatible trials, and the thick lines are incompatible trials. (d–f) Delta plots for the same data, separately for pure-correct (open circles) and partial-error (filled circles) trials
