
Figure 1.
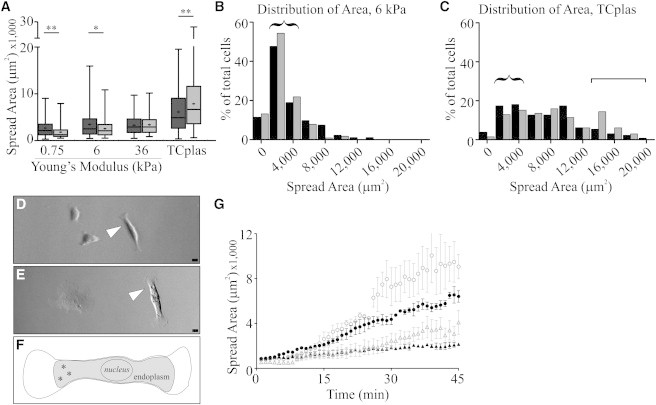
Cell spread area of normal and Vim−/− mEFs. Normal mEF spread more than vim−/− on soft substrates, but less on TCplas (A; dark bars, mEF; lighter bars, vim−/− mEF; 750 Pa: mEF, 2686 ± 2203 vs. vim−/−, 1806 ± 1350, p < 0.05; 6 kPa: mEF, 3457 ± 2870 vs. vim−/−, 2555 ± 1811, p < 0.02; TCplas: mEF, 6120 ± 4272 vs. vim−/−, 7878 ± 5441, p < 0.05; all n > 100 cells; errors are SD). Frequency distributions of cell spread areas on 6 kPa PAA (B) and TCplas (C; black, mEF; gray, vim−/− mEF) show the availability of cells with spread areas ∼2500–4000 μm2 on both substrates (curly brackets; n = 3, ≥50 cells per experiment) and cells with areas >14,000 μm2 on TCplas (square bracket). Differential interference contrast images of exemplar cells (indicated by arrowheads) on 6 kPa PAA (D) and TCplas (E) show the bipolar shapes of 2500–4000 μm2 cells selected for AFM, also illustrated in (F; asterisks indicate location of AFM indentation in the distal endoplasmic region). Bars = 20 μm. Cell spread areas were determined following subculturing beginning from the first frame after which the cell stopped translocating, indicating attachment to the substrate (G; solid shapes, mEF; open, vim−/−; Fn-TCplas, circles; ColI-TCplas, triangles). ∼26 min postattachment, vim−/− mEFs begin to spread more rapidly than normal mEFs on Fn- or Col1-treated TCplas (n = 8 cells per condition collected over a minimum of 2 experiments; errors SE).