Figure 3.

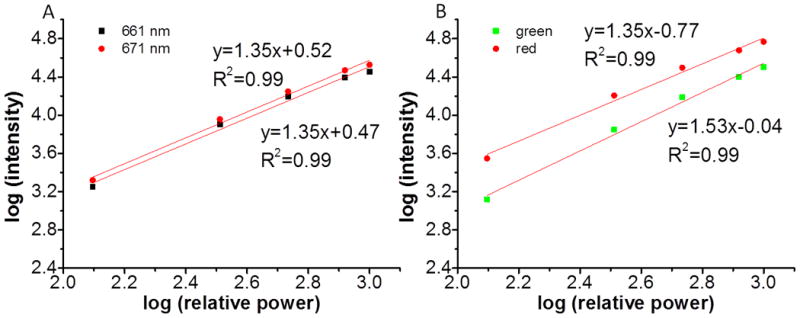
A. Power dependence of the two closely-spaced red emission peaks, 661 nm (black squares) and 671 nm (red dots) of the UCPs. B. Power dependence of the green and red emission of the UCPs in green squares and red dots, respectively.

A. Power dependence of the two closely-spaced red emission peaks, 661 nm (black squares) and 671 nm (red dots) of the UCPs. B. Power dependence of the green and red emission of the UCPs in green squares and red dots, respectively.