
Figure 4. Hemodynamic responses and neuronal activity evoked by ChR2 stimulation are partially co-localized in S1.
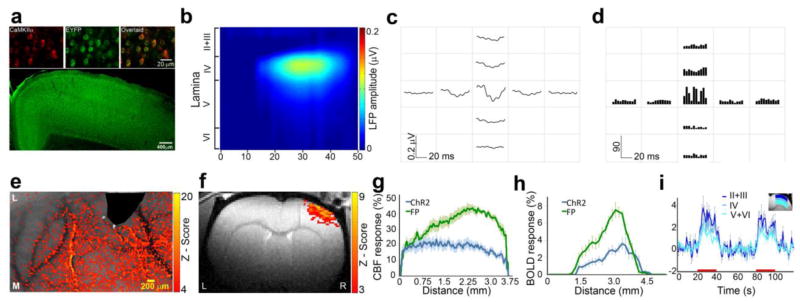
a. Examples of neurons within S1 immunostained with antibodies targeted towards EYFP (green, indicative of ChR2 expression) and CaMKIIα (red, marker of excitatory pyramidal neurons). A large field of view fluorescence image shows that ChR2 expressing neurons are located throughout the cortex. b. Example of evoked LFP responses to ChR2 stimulation shows that responses were confined to laminae II+III and IV. c. ChR2 stimulation resulted in evoked LFP responses that were observed only in electrodes proximate to the optic fiber with a distance less than 500 μm. d. ChR2 stimulation resulted in increased MUA spiking activities only in electrodes proximate to the optic fiber. e. Example of CBF activation z-map shows that ChR2 stimulations resulted in extensive CBF increases in S1. f. Example of BOLD fMRI activation z-map shows that ChR2 stimulations resulted in extensive BOLD fMRI responses in S1. g. Group average of the CBF responses across S1 representation (in the medial-lateral axis) demonstrates similar spatial extent of the hemodynamic responses induced by forepaw and ChR2 stimulations (mean ± SEM, n=5). h. Group average of the BOLD fMRI responses across lamina IV S1 representation (in the medial-lateral axis) demonstrates similar extent and localization of the hemodynamic responses induced by forepaw and ChR2 stimulations (mean ± SEM, n=5). I. Time courses of BOLD fMRI responses across the cortical laminae evoked by ChR2 (mean ± SEM, n=5).