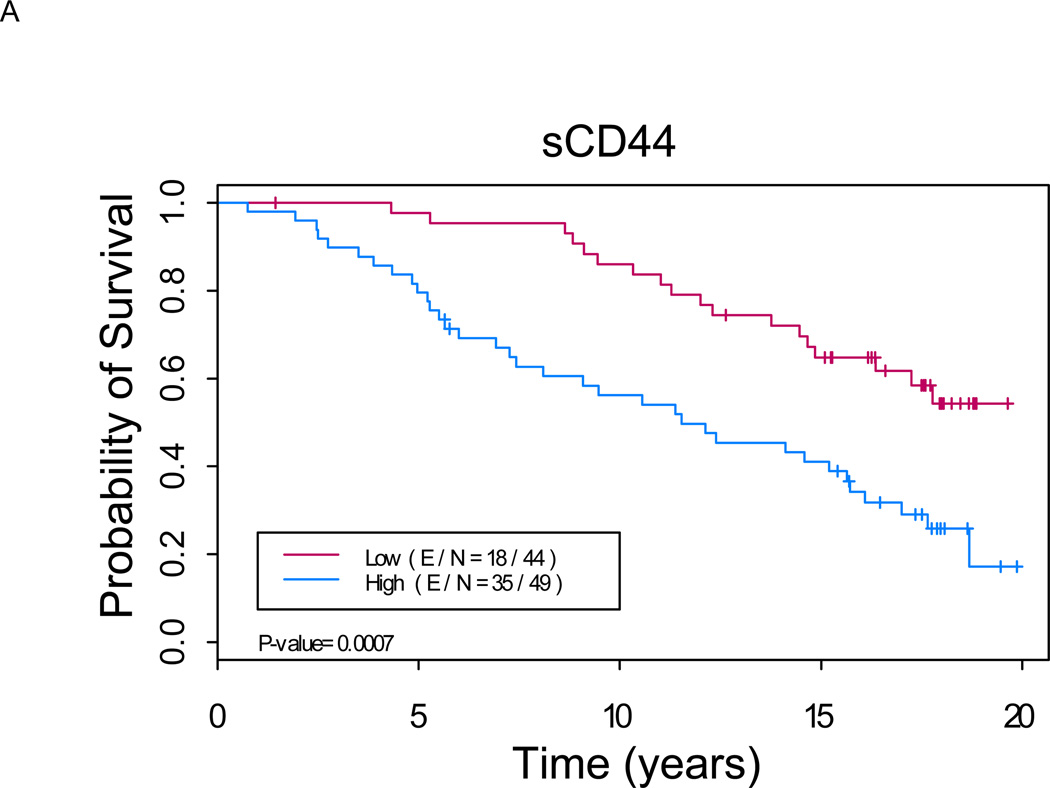
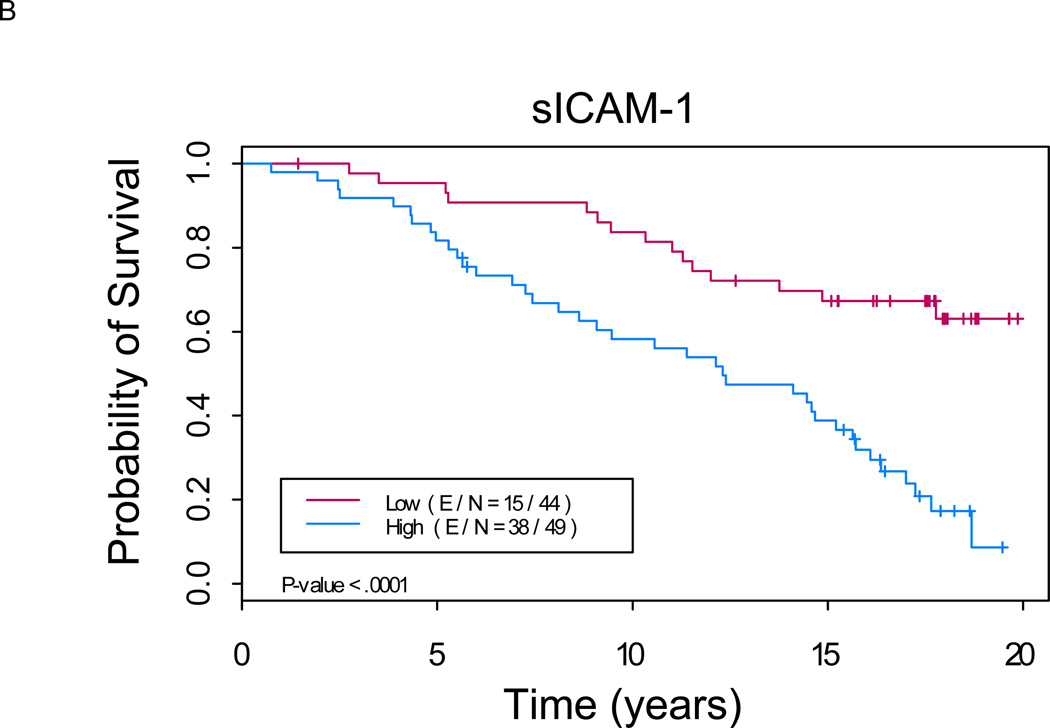
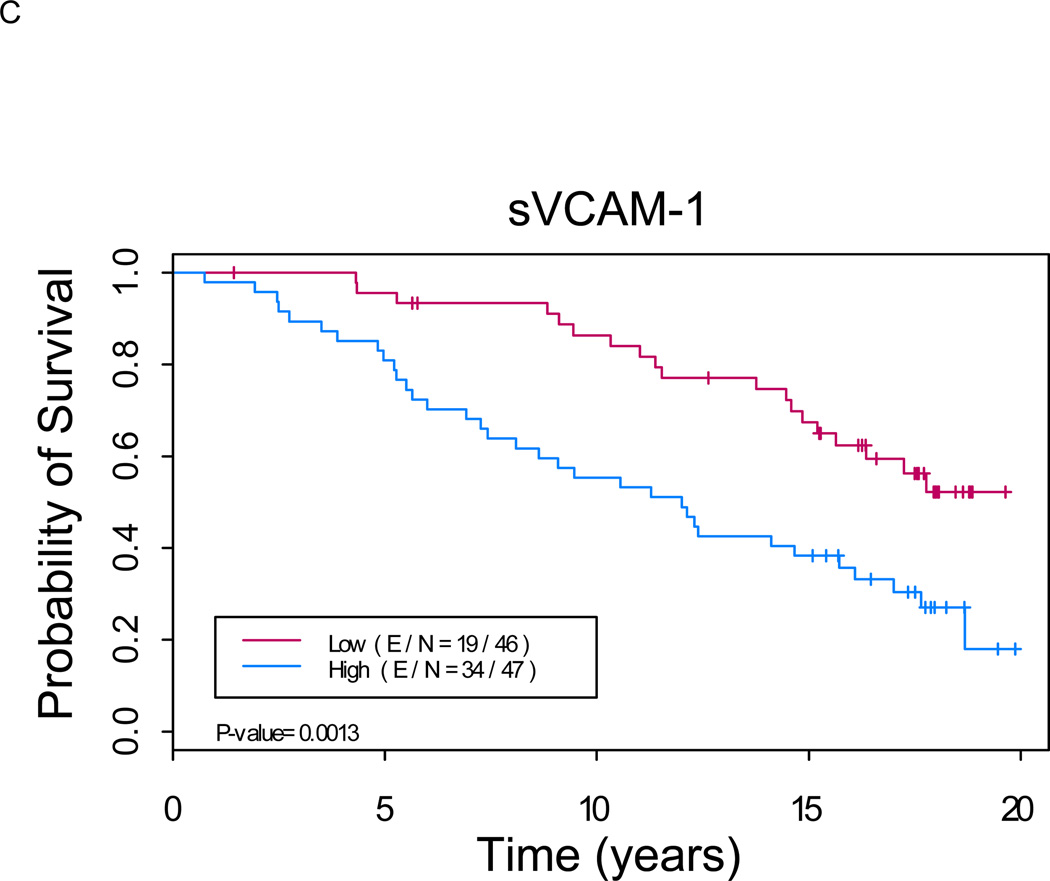
Figure 1. Kaplan-Meier analysis shows a significant difference in overall survival between patients with low versus high levels of serum markers (p < 0.01 for each marker).
A. sCD44: Median OS of 11.5 years (8.1, 16.1) in “sCD44 high” group versus not reached in “sCD44 low” group (p=0.0007). B. sICAM-1: Median OS of 12.3 years (9.1, 15.7) in “sICAM-1 high” group versus not reached in “sICAM-1 low” group (p<0.0001). C. sVCAM-1: Median OS of 12.0 years (8.1, 17.0) in “sVCAM-1 high” group versus not reached in “sVCAM-1 low” group (p<0.0001). (E/N = Events per number of patients in a particular group.)


