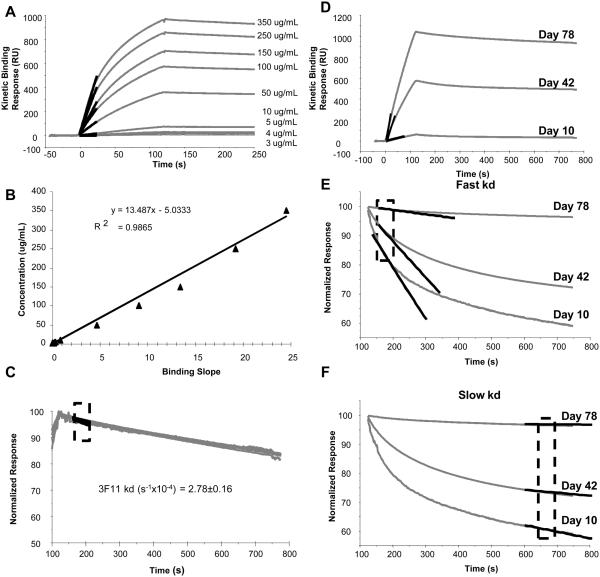
Fig. 2.
Calculation of antibody concentration and dissociation rate. A, Anti-rPA monoclonal antibody 3F11 was run at known concentrations over r-PA immobilized sensor surface. The highlighted region shows the slope calculated from a 10-second window during the first 30 seconds of the injection, when binding is limited by mass transfer. B, Binding slopes derived from data shown in A were plotted against the known 3F11 concentrations to generate the standard curve. The standard curve was used to calculate equivalent concentration of rPA-specific antibody from binding response slopes measured in sera. C, Dissociation rate constants (kd) were measured in a 50-second window during the early phase (after injection), shown in the highlighted region. Mean and standard error of kd measurement of 3F11 was calculated from a range of 10-350 μg/mL and is shown to be independent of concentration. D, Representative binding curves of polyclonal sera from three different post immunization time. The measured slope of each of the binding response is highlighted. E Biphasic dissociation phase of each the polyclonal sera and the fitted slope for kd measurement of the fast component is shown. The kd of the fast component was calculated within the boxed region. F, The slower component of the dissociation phase is highlighted and the fitted curve for kd measuerment is shown. The measured kd for both the fast and the slow components are given in Table 1.

