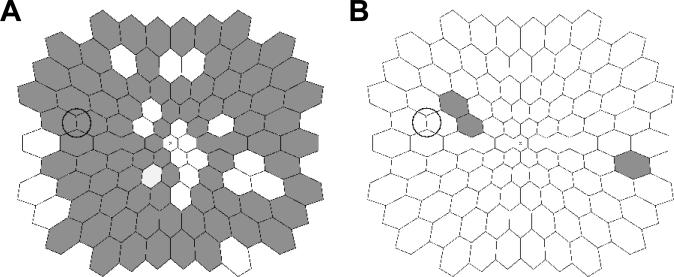
Figure 2.
(A) Comparison of local ITs between the younger males and females. Dark hexagons indicate retinal locations where local ITs of the younger females were significantly shorter than the corresponding ITs of the younger males. (B) Comparison of local ITs between the older males and females (excluding those with hysterectomies). Shaded hexagons indicate retinal locations where local ITs of the older females were significantly shorter than the corresponding ITs of the older males. Diagrams show retinal view in left-eye format, the circle indicates the optic disc, and “x” indicates the foveola.

