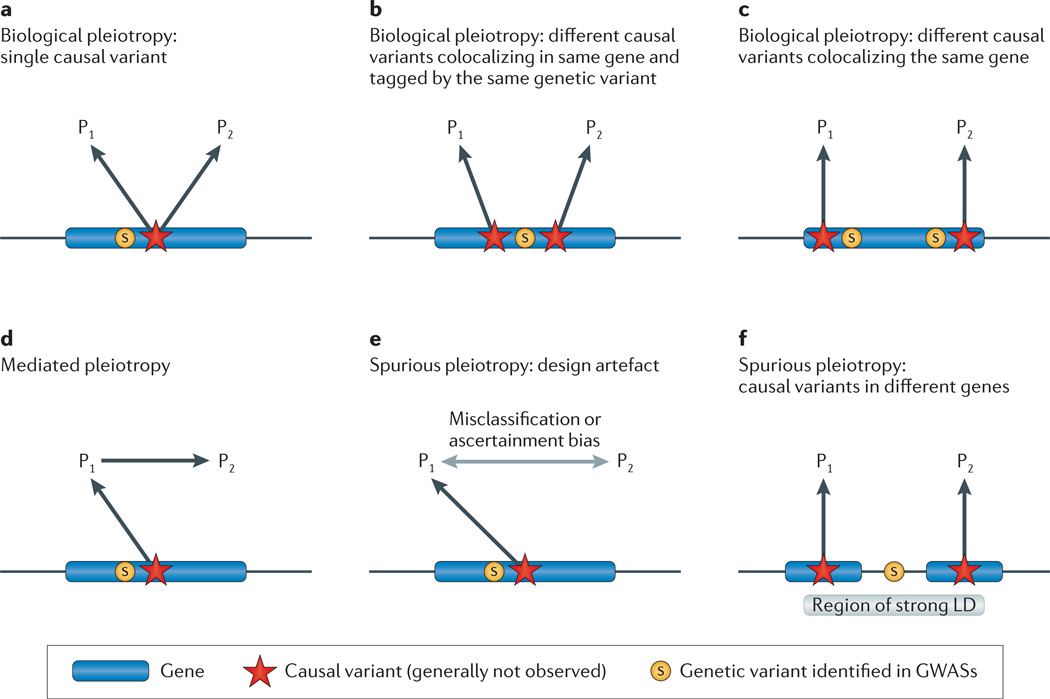
Figure 1. Types of pleiotropy.
In each scenario, the observed genetic variant (S) is associated with phenotypes 1 and 2 (P1 and P2). We assume that the observed genetic variant is in linkage disequilibrium (LD) with a causal variant (red star) that affects one or more phenotypes. In some cases, the causal variant may be identified directly and the figures can be simplified accordingly. The various figures correspond to the unobserved underlying pleiotropic structure. a | Biological pleiotropy at the allelic level: the causal variant affects both phenotypes. b | Colocalizing association (biological pleiotropy): the observed genetic variant is in strong LD with two causal variants in the same gene that affect different phenotypes. c | Biological pleiotropy at the genic level: two independent causal variants in the same gene affect different phenotypes. d | Mediated pleiotropy: the causal variant affects P1, which lies on the causal path to P2, and thus an association occurs between the observed variant and both phenotypes. e | Spurious pleiotropy: the causal variant affects only P1, but P2 is enriched for P1 owing to misclassification or ascertainment bias, and a spurious association occurs between the observed variant and the phenotype 2. f | Spurious pleiotropy: the observed variant is in LD with two causal variants in different genes that affect different phenotypes. GWAS, genome-wide association study.

