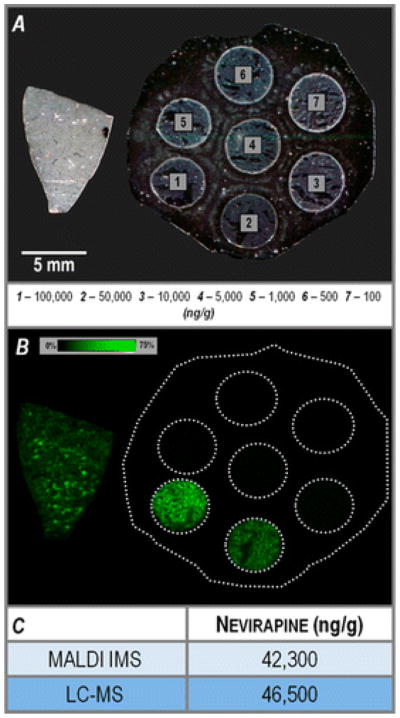
Figure 7.

Quantitative analysis of a rat liver section dosed with the drug nevirapine (m/z 267.124) using a mimetic tissue model. (A) Optical scan of sections from the nevirapine-dosed rat liver (left) and the mimetic tissue model (right), before matrix application. (B) Ion image for nevirapine, m/z 267.124, at 75% maximum intensity threshold. (C) Comparison of nevirapine quantification results from the MALDI IMS and LC-MS analyses.
