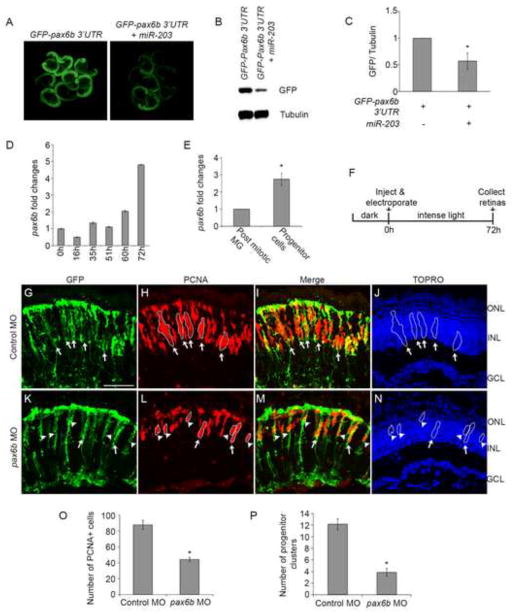
Figure 6. miR-203 regulates retina regeneration through pax6b.
(A–C) miR-203 targets the 3′ UTR of pax6b. The pax6b 3′UTR was fused to the GFP coding sequence. Single-cell zebrafish embryos were injected with in vitro transcribed mRNA from the GFP fusion construct in the presence or absence of miR-203. (A) Representative fluorescent images of injected embryos at 1dpf. (B) Western blot for GFP and α-tubulin control was performed on lysates prepared from the injected embryos in (A). (C) Quantification of GFP/tubulin ratios from multiple western blots as in (B). Data represent mean +/− s.d. (n=3 separate injection experiments); *, p< 0.008 by Student t-test. (D–E) pax6b mRNA is upregulated during retina regeneration. (D) qPCR was performed to quantitate pax6b levels from whole retina RNA. (E) qPCR for pax6b in FACS purified post mitotic MG and progenitor cells from 72h light treated fish. Data represent relative pax6b mRNA levels and show mean +/− s.e.m from 3 separate FACS experiments (n=3); *, p< 0.008 by Student t-test. For each FACS experiment post mitotic MG were purified from 15 undamaged fish and progenitor cells were purified from 20 light damaged fish. Samples were assayed in triplicate. 18s rRNA served as endogenous RNA control. (F) Experimental scheme for morpholino (MO) knockdown experiments in panels G–P. (G–N) Control MOs or pax6b MOs were injected and electroporated into the left eyes of tg:1016tuba1a:gfp fish prior to intense light exposure. Following 72h of light exposure, retinas were sectioned and stained with antibodies against GFP (green; panels G, K) and PCNA (red; panels H, L); nuclei were counterstained with TOPRO (blue; panels J, N). In the control MO treated retinas, large clusters of PCNA+ cells associated along the processes of dedifferentiated MG (arrows in G–J). pax6b MO treatment reduced the number of dedifferentiated MG associated with progenitor clusters (arrows in K–N) but increased the number of dedifferentiated MG associated with 1–3 PCNA+ cells (arrow heads in K–N). (O) Quantification of PCNA+ cells. (P) Quantification of number of dedifferentiated MG associated with progenitor clusters. Data represent mean +/− s.e.m (n= 6–7 fish); *, p< 0.002 by Mann-Whitney U test. ONL, outer nuclear layer; INL, inner nuclear layer; GCL, ganglion cell layer. Scale bar 50um.

