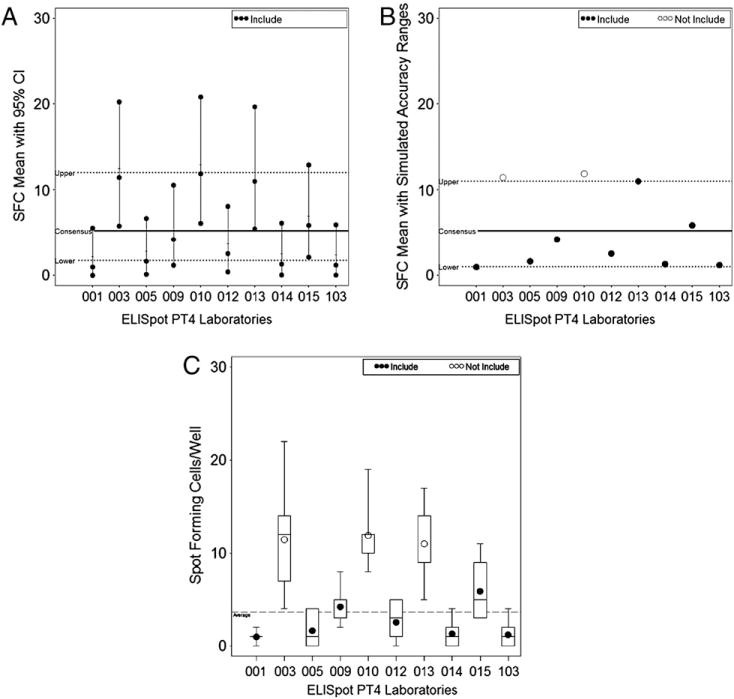
Fig. 1.

ELISpot graphs for donor 1 reagent A. A) All exact 95% CIs overlap and no laboratories were considered outside the acceptability range for this donor by stimulation. B) Using an acceptability range created using simulations, laboratories 003 and 010 are considered outside the acceptability range for this donor by stimulation. C) Laboratories 003, 010, and 013 are outside the acceptability range using a mixed effects model.
