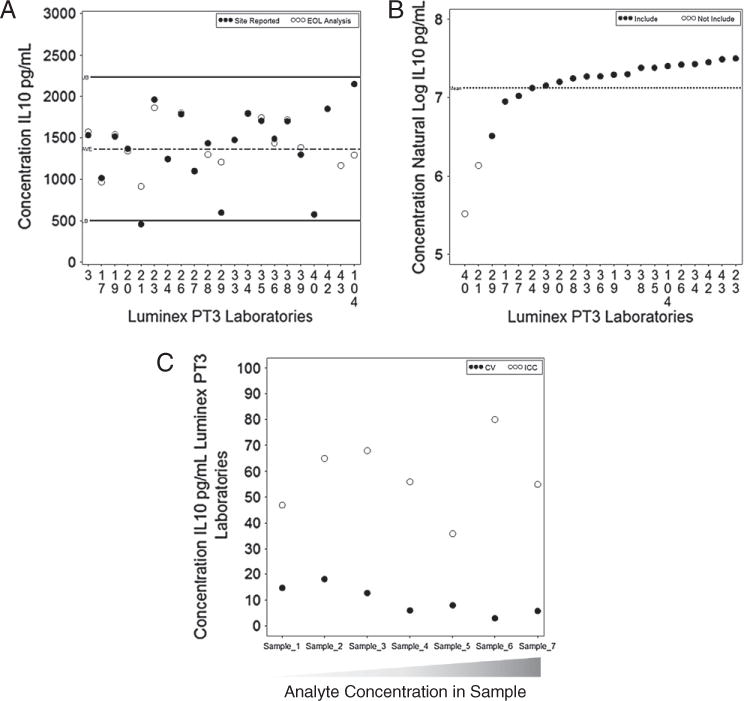
Fig. 3.

Luminex graphs for accuracy and precision. A) Example of the Wald-type 95% CI method graphed for one sample type included in the PT round 3 with analyte IL-10. B) The mixed effects model method graphed for the same sample type as in 3a for analyte IL-10. The two laboratories (unfilled circles) are not included in the accuracy range. C) The CVs and ICCs graphed for all samples with analyte IL-10. The samples are ordered from the lowest concentration to the highest concentration of the analyte present in the panel.
