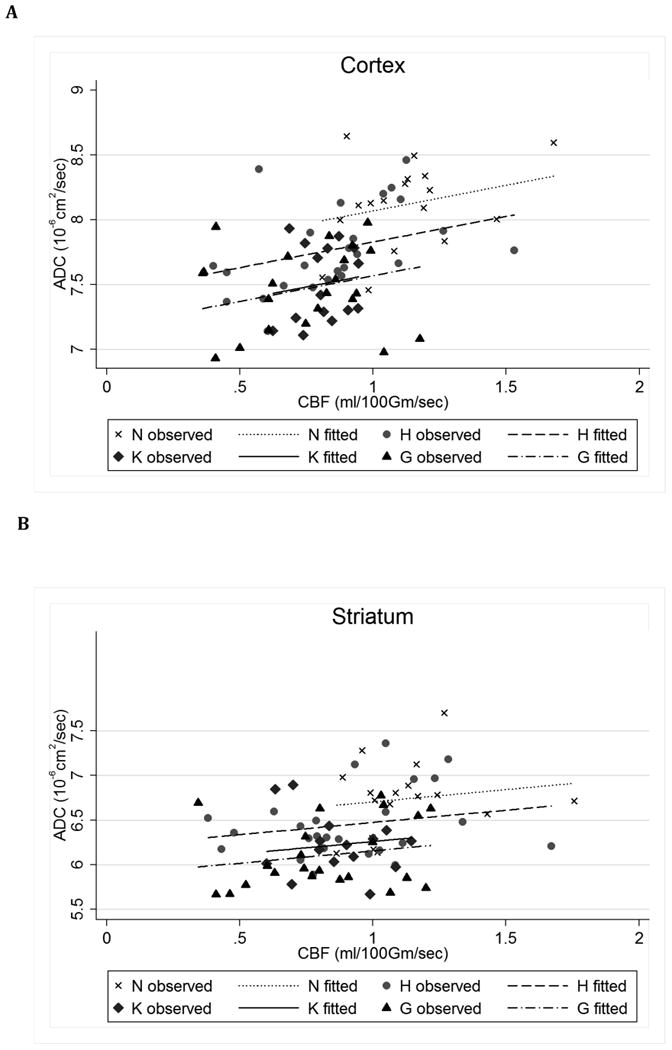
Figure 3. Correlation between CBF and ADC values under different physiologic conditions.

ANCOVA models with region-specific ADC (dependent variable), adjusting for region-specific CBF, to estimate adjusted mean differences (AMD) and (simultaneous 95% CI) for each of the three groups vs the reference group of hypocapnia. For AMD, the Tukey-Kramer multiple comparisons procedure was used to estimate 95% CI (shown in parentheses) and p-values, with statistical significance declared for simultaneous p < 0.05 to control the familywise Type-1 error rate. Cortex: ANCOVA model F(4,74)=13.92, p<0.001. Model R-square=0.43, root mean square error=0.31. AMD for N vs. H = 0.24 ( -0.04, 0.52 ), p=0.12; G vs. H = -0.26 ( -0.50, -0.02 ), p=0.03; K vs. H = -0.25 ( -0.51, 0.02 ), p=0.08 . Striatum: ANCOVA model F(4,74)=8.08, p<0.001. Model R-square=0.30; root mean square error=0.38. AMD (95% CI): N vs. H = 0.23 ( -0.10, 0.56 ), p=0.26; G vs. H = -0.32 ( -0.61, -0.02 ), p=0.03; K vs. H = -0.21 ( -0.54, 0.11 ), p=0.32.
