
Figure 5. Changes in ADC with normalization of CO2 after hypocapnia are similar under control conditions, hyperglycemia or ketosis.
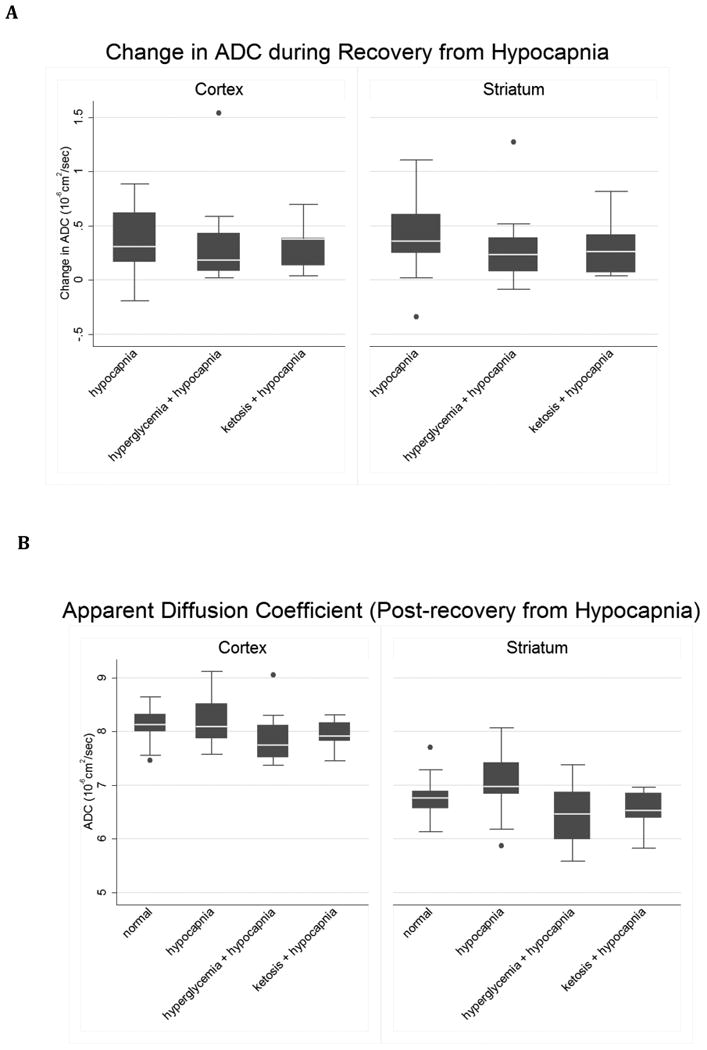
A. control (n=14), hyperglycemia (n=12) and ketosis (n=9). Cortex: Oneway ANOVA omnibus F-test: F(2,32)=0.07, p=0.94. Striatum: omnibus F(2,32)=0.40, p=0.67. B. ADC in normal control (n=17) and in hypocapnic rats after CO2 normalization: hypocapnia only (H), hyperglycemia plus hypocapnia (G) and ketosis plus hypocapnia (K).). Pairwise contrasts in means, (95% CI) and p-values were estimated using Tukey-Kramer multiple comparisons procedure to control the familywise Type-1 error rate, with statistical significance declared for simultaneous p < 0.05. Cortex: Oneway ANOVA omnibus F(3,48) = 2.18, p=0.10. Model R-square=0.12; root mean square error=0.42. H vs. N= 0.13 ( -0.27, 0.53 ), p=0.82; K vs. N= -0.19 ( -0.65, 0.27 ), p=0.69; G vs. N = -0.25 ( -0.67, 0.17 ), p=0.41; H vs. K = 0.32 ( -0.15, 0.80 ), p=0.29; H vs. G = 0.38 ( -0.06, 0.82 ), p=0.11; K vs. G = 0.06 ( -0.43, 0.55 ), p=0.99. Outlier-resistant robust ANOVA, H vs. G contrast (unadjusted 98.33% CI) = 0.40 ( 0.01, 0.79 ), unadjusted p=0.014. Best fitting model of group means (Dayton's PCAIC procedure): H = N > K = G. Striatum: Omnibus F(3,48) = 3.16, p=0.03. Model R-square=0.17; root mean square error=0.49. Pairwise contrasts involving normal controls: H vs. N=0.27 ( -0.20, 0.74 ), p=0.43; K vs. N = -0.22 ( -0.76, 0.32 ), p=0.70; G vs. N = -0.27 ( -0.76, 0.22 ), p=0.48. Pairwise contrasts among the hypocapnia groups: H vs. K = 0.49 ( -0.07,1.05 ), p=0.10; H vs. G = 0.54 ( 0.03, 1.06 ), p=0.04; K vs. G = 0.05 ( -0.53, 0.63 ), p=0.996. Outlier-resistant robust ANOVA, H vs. K contrast (98.33% CI) = 0.54 ( 0.07, 1.02 ), unadjusted p=0.006. Best fitting model of group means (Dayton's PCAIC procedure): H > N > K = G .