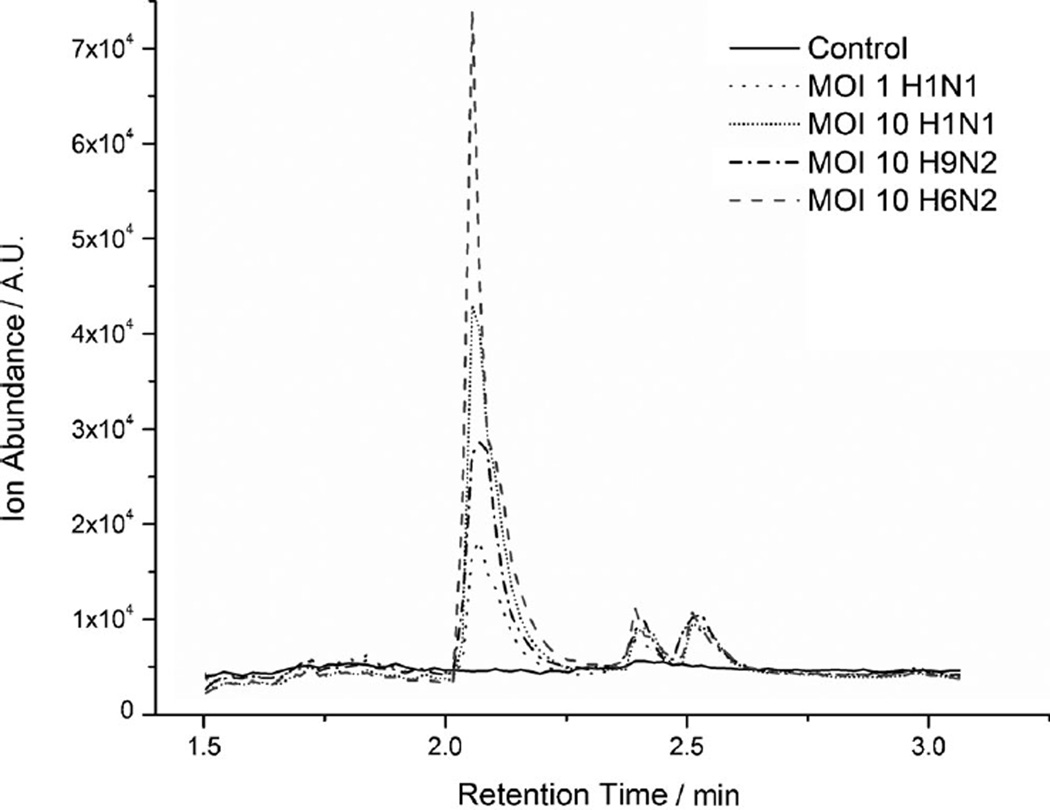
Figure 2.
Overlay of GC chromatograms differentiates between uninfected C1R cells and those infected as indicated and incubated for 48 h. Peak C1 (Tables 1, 2, S1, and S2) was identified as 2-methoxy-ethanol. Representative chromatograms of 12 replicates are shown. The p value p ≤ 0.05 was used throughout.

