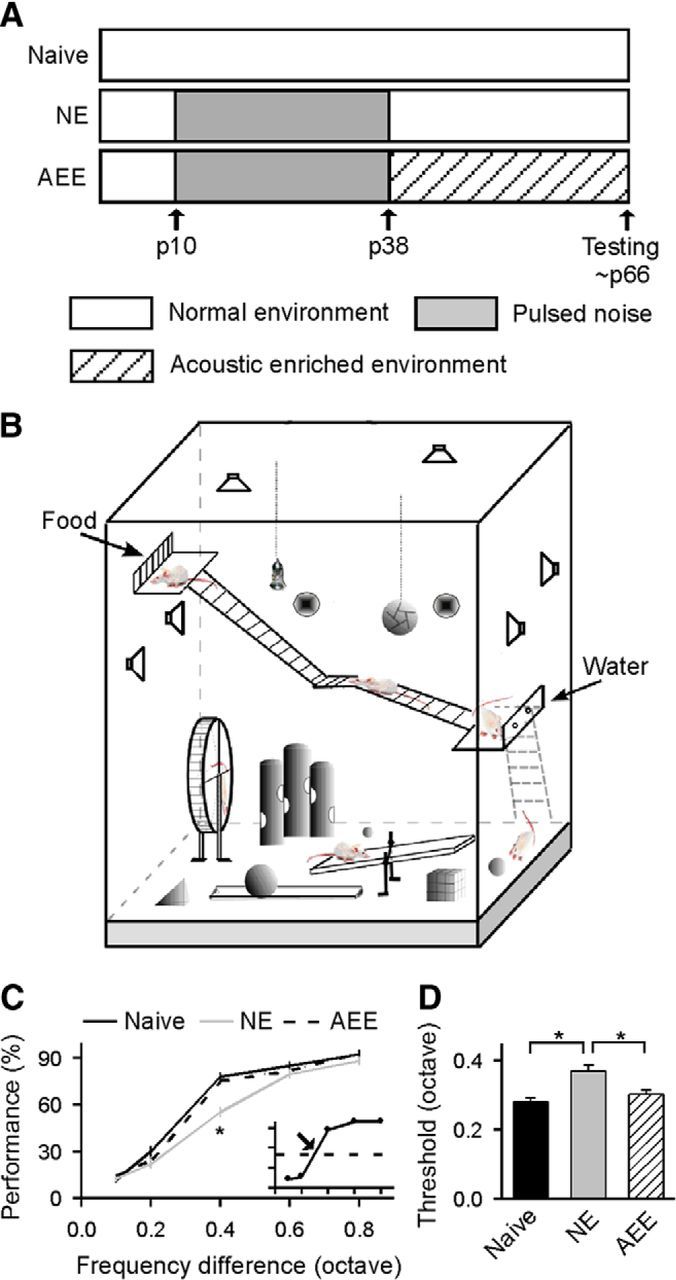
Figure 1.

Behavioral performance on the frequency discrimination task. A, Experimental timelines for naive, NE, and AEE rats. B, Schematic of enriched housing conditions. An AEE consisted of five to six rats housed in a large cage that contained a running wheel, a seesaw, balls, tunnels, cubes, cone toys, stairs, ramps, and platforms. Speakers around the cage randomly emitted pure tones with different frequencies. Three such cages were decorated in different styles and rats in each cage were switched to a different cage every 3–4 d to maintain novelty. C, Average psychometric curves obtained from naive (N = 11), NE (N = 10), and AEE (N = 11) rats. Error bar indicates SEM. Inset shows an example of the psychometric curve. Dashed line and arrow in the inset show 50% of maximal score and the discrimination threshold, respectively; *p < 0.001. D, Comparison of discrimination thresholds for the different groups; *p < 0.005.
