
Figure 1.
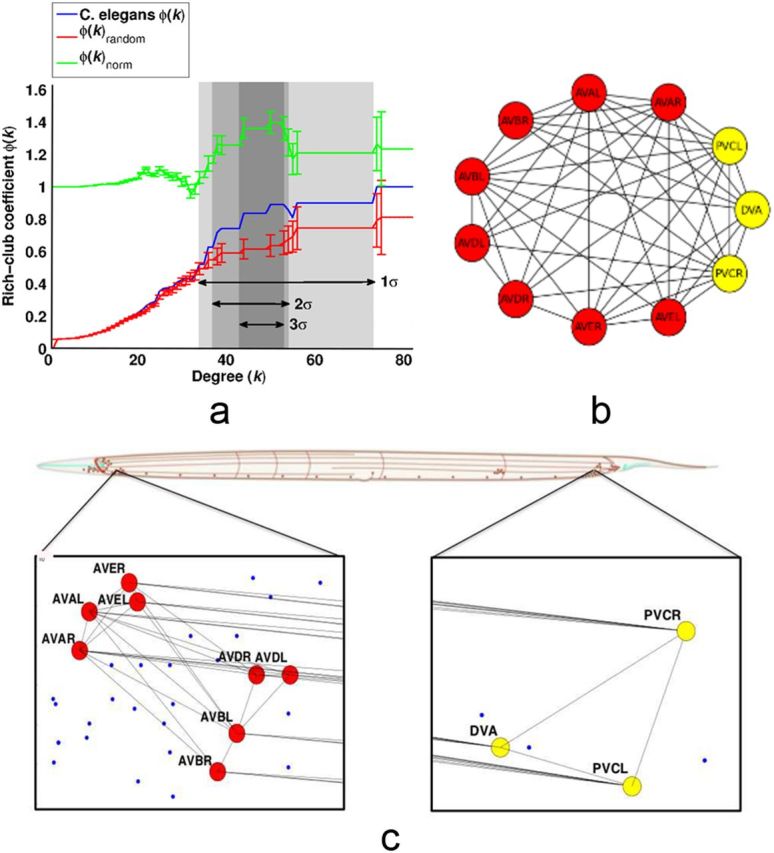
Rich club of the C. elegans nervous system. a, The blue curve illustrates the rich club coefficient Φ(k) for the C. elegans neuronal network and the red curve is a randomized rich club curve, Φrandom(k), generated by averaging the rich club coefficients of 1000 random graphs at each value of k. The green curve is the normalized coefficient. Error bars on the Φrandom(k) and Φnorm(k) curves are 1σ of the random graphs. Φ(k) ≥ Φrandom(k) + 1σ over the range 35 ≤ k ≤ 73, indicating that this is the rich club regime (highlighted in lightest gray). The more conservatively defined rich clubs of Φ(k) ≥ Φrandom(k) + 2σ and Φ(k) ≥ Φrandom(k) + 3σ are shaded darker grey (Table 1). b, A purely topological view of the rich club network. Nodes in yellow are located in the tail and those in red are located in the head. c, The rich club is shown in the context of the whole body of the animal. It only has components in the head and tail, which are enlarged to show the subset DVA and PVCL/R (tail, right) and the subset AVAL/R, AVBL/R, AVDL/R, and AVEL/R (head, left). Only synaptic connections between rich club neurons are shown.