
Figure 2.
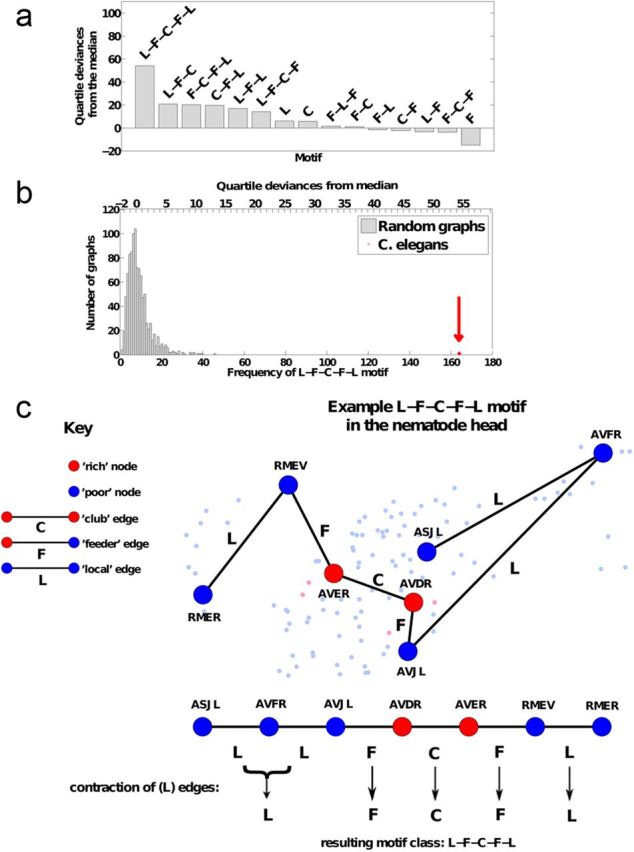
Motifs of the C. elegans network. a, The frequency of motif occurrence in the nematode network, compared with frequency of the same motif occurring in random networks, was defined in terms of interquartile deviances from the median and motifs were ranked in order of decreasing values. The motif that occurred with greatest (nonrandom) significance in the nematode network linked a pair of peripheral nodes via a series of local (L), feeder (F), and club (C) edges (denoted L-F-C-F-L). This indicates that many more of the shortest paths between peripheral neurons in the C. elegans network are mediated by the rich club than would be expected in a random network. b, The histogram shows the frequency distribution of the L-F-C-F-L motif in 1000 random networks. The frequency of the L-F-C-F-L motif in the nematode network is also shown; it is greater than the maximum frequency in the random network distribution, so it has p < 1/1000 = 0.001 under the null hypothesis that the frequency distribution of this motif is random in the nematode network. The top x-axis marks quartile deviances from the median, a nonparametric measure of distance from the central location of the random distribution. c, Construction of motifs from the shortest paths between pairs of neurons. As described in the key, rich club neurons are colored red and peripheral neurons are colored blue. An example of the frequently occurring motif L-F-C-F-L is given as a series of local (L), feeder (F) and club (C) connections to show how the topologically central rich club mediates many of the connections between topologically more peripheral neurons in the nematode nervous system. It is also illustrated anatomically within the head of the C. elegans network, where large bold nodes belong to the L-F-C-F-L motif and small pale nodes are in the rest of the network.