
Fig. 4. Vps20 binding to membrane-bound Snf7.
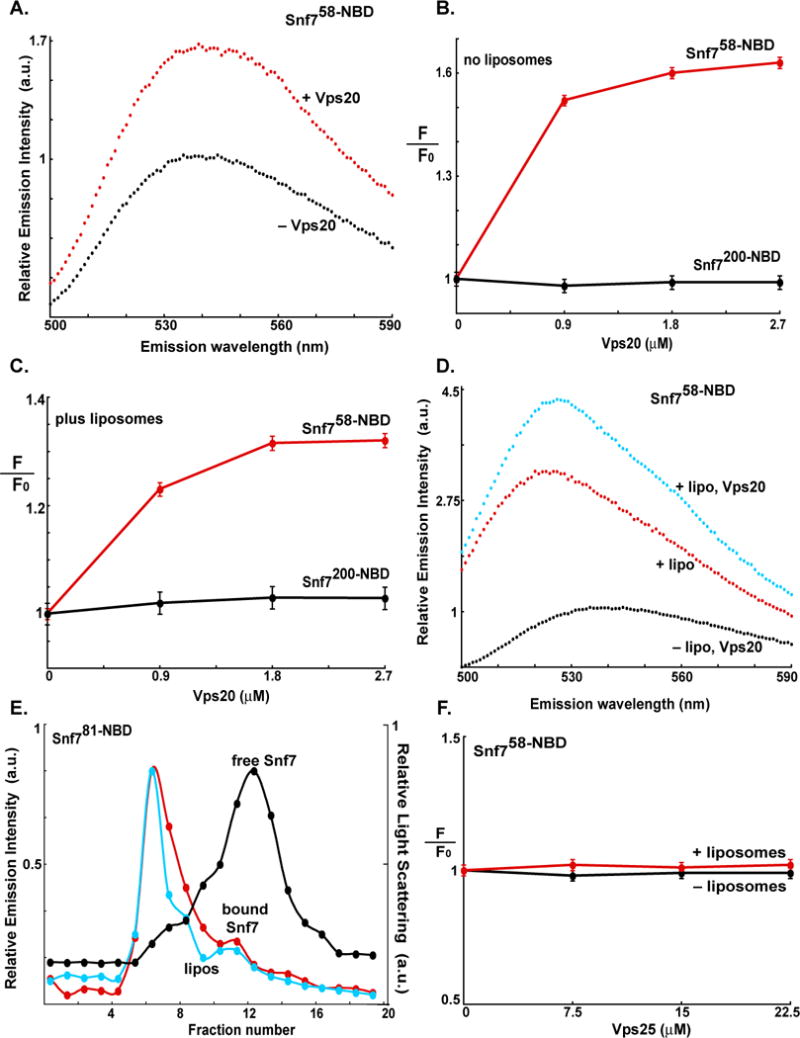
Fluorescence emission spectra of 300 nM Snf7200-NBD (A) and 2.2 μM Snf758-NBD (B) before (black) and after (red) addition of Vps20. Titration (λem = 530 nm) of 300 nM Snf7200-NBD (black) and 2.2 μM Snf758-NBD (red) with Vps20 either before (C) or after incubation with 1.5 mM PC/PS/PI (D). (E) Emission spectra of 2.2 μM Snf758-NBD bound to 1.5 mM PC/PS/PI before (red) and after (cyan) addition of 2.7 μM Vps20. For comparison, the spectrum of 2.2 μM Snf758-NBD in buffer is shown (black). (F) Sepharose CL-2B chromatography of samples containing 540 nM Snf781-NBD and 2.7 μM Vps20 that had been preincubated with either 1.5 mM PC/PS/PI (red) or no liposomes (black). Protein was detected by NBD emission intensity, and liposomes by light scattering (cyan).