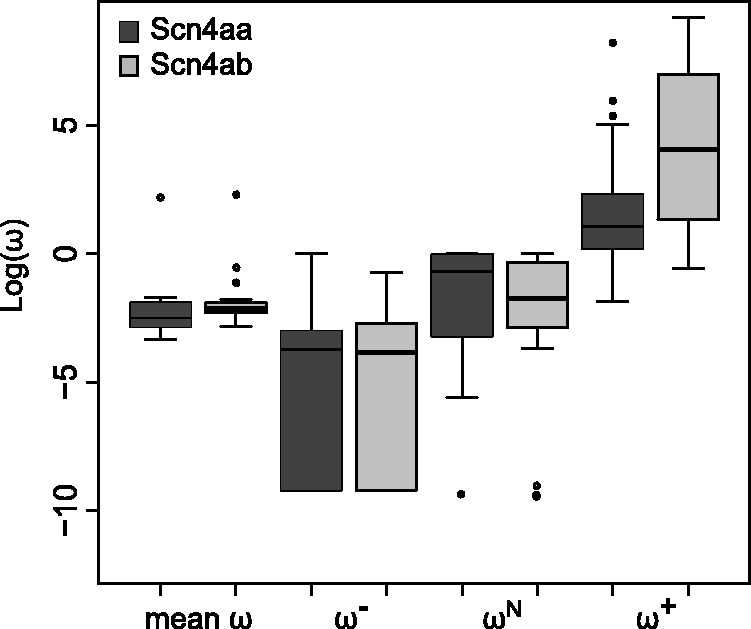
Fig. 6.

Comparison of dN/dS (ω) between the two paralogs. Up to three different ω rates were fit to each branch of a phylogeny containing both paralogs: Purifying selection (ω−), nearly neutral selection (ωN), and positive selection (ω+). Box and whisker plots compare the distribution of each of the rate classes between the two paralogs Scn4aa and Scn4ab. Because some estimates in the purifying selection class were zero, a constant of 0.0001 was added to each value. This had no effect on the results of statistical tests but prevented box plots from stretching to negative infinity in the purifying selection rate class. The bold line represents the median value, the box spans the two interquartiles, and the whiskers represent the minimum and maximum values of the data, excepting outliers, which are represented as dots.
