
Fig. 3.
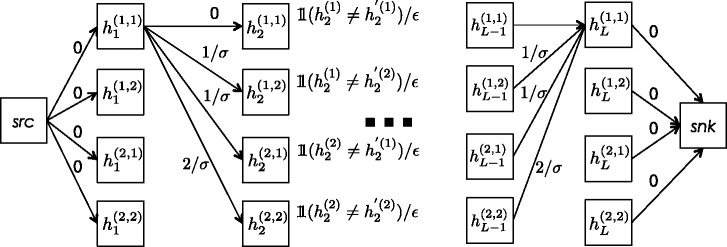
Graph illustrating the HaploScore computation. The HaploScore for an IBD segment of length L can be represented as the minimum-cost path through the above DAG, where ε denotes the probability of a genotyping error and σ denotes the probability of a switch error at any given site. The DAG has one source, one sink, and one level per genotyped site in the IBD segment. At each level l, the DAG contains four nodes, indicating the haplotype configuration at site l. Each node has weight 0 if the two corresponding alleles are the same, or 1/ε if they are different. Each node in level l has four outgoing directed edges, one to each of the four nodes in level l + 1. The edge weights are 0, 1/σ, or 2/σ, depending on whether 0, 1, or 2 switch errors are necessary to explain the transition. For clarity, some edges are omitted in this figure. The source node src has four outgoing directed edges with weight 0, one to each of the four nodes in level 1. Each node in level L has one outgoing directed edge to the sink node snk with weight 0.