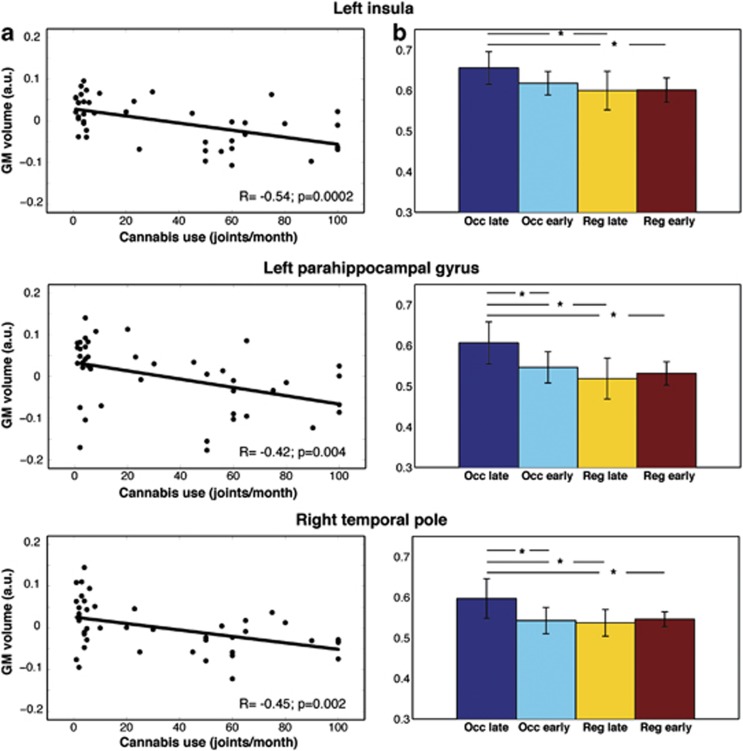
Figure 2.
(a) Correlation between the modulated gray matter intensity at the center of gravity of the significant clusters and the monthly frequency of joints smoked during 3 months before inclusion in the study. Lines represent the fitting of the distribution of the values. Pearson's correlation coefficient and P-value are shown at the bottom of each plot. (b) Mean GM volume across the four subgroups (Occasional late, Occasional early, Regular late, Regular early). Whiskers represent 95% confidence interval, horizontal lines represent significant comparisons and stars the significance level (P<0.05).

