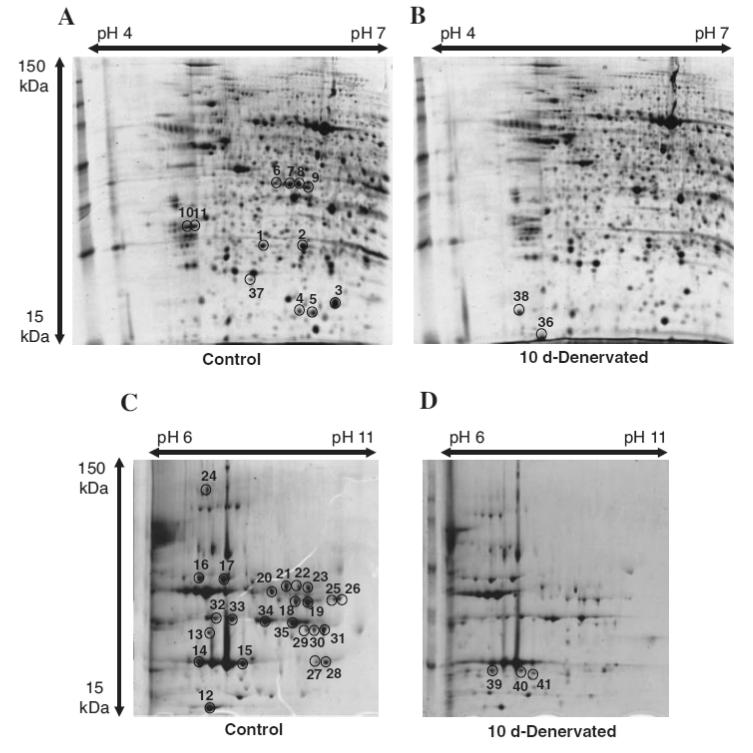
Fig. 3. Proteome Map of Sarcoplasmic Fraction of (A, pH 4–7), (C, pH 6–11) Normal Soleus Muscle (B, pH 4–7). (D, pH 6–11) and Denervated (10 d) Soleus Muscle.
Sarcoplasmic protein of normal and denervated soleus muscle applied equally (300 μg for pH 4–7, 200 μg for pH 6–11) to 2-DE. The pH-values of the first dimension gel system and the molecular mass standards (in kDa) of the second dimension are indicated at the top and the left of the panel respectively. Muscle proteins with drastically different expression levels are marked by circles, and are numbered 1–41. See Table 2 for a detailed listing of proteins in the sarcoplasmic fraction with changed abundances in the denervated soleus muscle.

