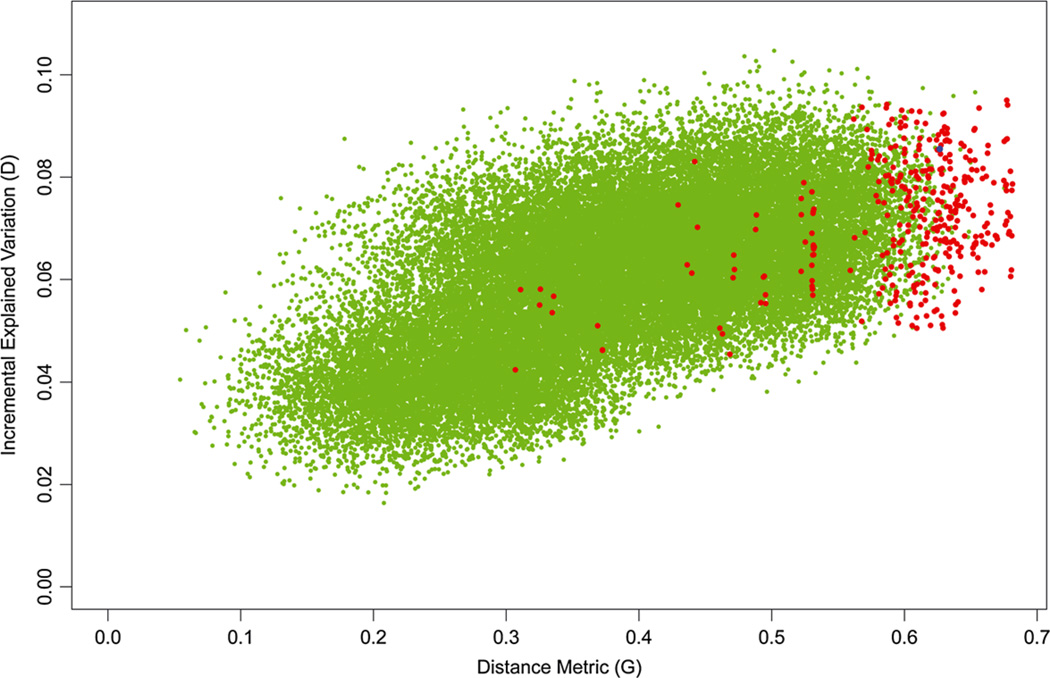
Figure 3.
This figure is similar to Figure 2, except that the green dots represent a random sample of 50,000 candidate configurations. The blue dot corresponds to the widely used four-class system: luminal A, luminal B, HER2-enriched and triple negative.

