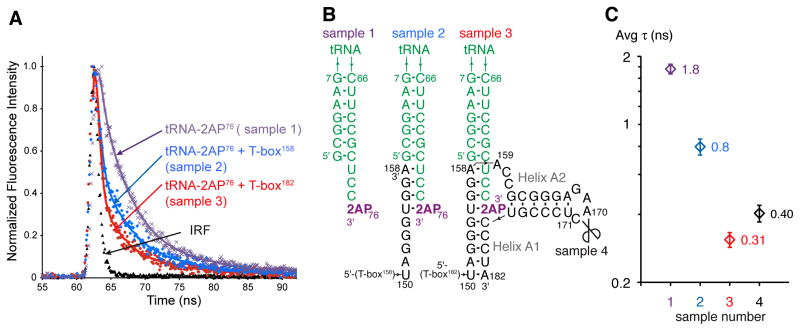
Figure 3. 2AP Fluorescence Lifetimes Reveal the Structural Context of the tRNA 3′ End Bound to the T-box Antiterminator.
(A) Normalized traces of 2AP fluorescence decay and best fits for RNAs in (B). IRF: instrument response function.
(B) Secondary structures of RNAs analyzed in (A). Scissors indicate nick position in the split T-box reconstituted with T-box170 and T-box171–182.
(C) Average 2AP fluorescence lifetimes of the RNAs shown in (B), as colored in (A). See also Figure S3. Error bars represent s.d. from three independent experimental replicates.

