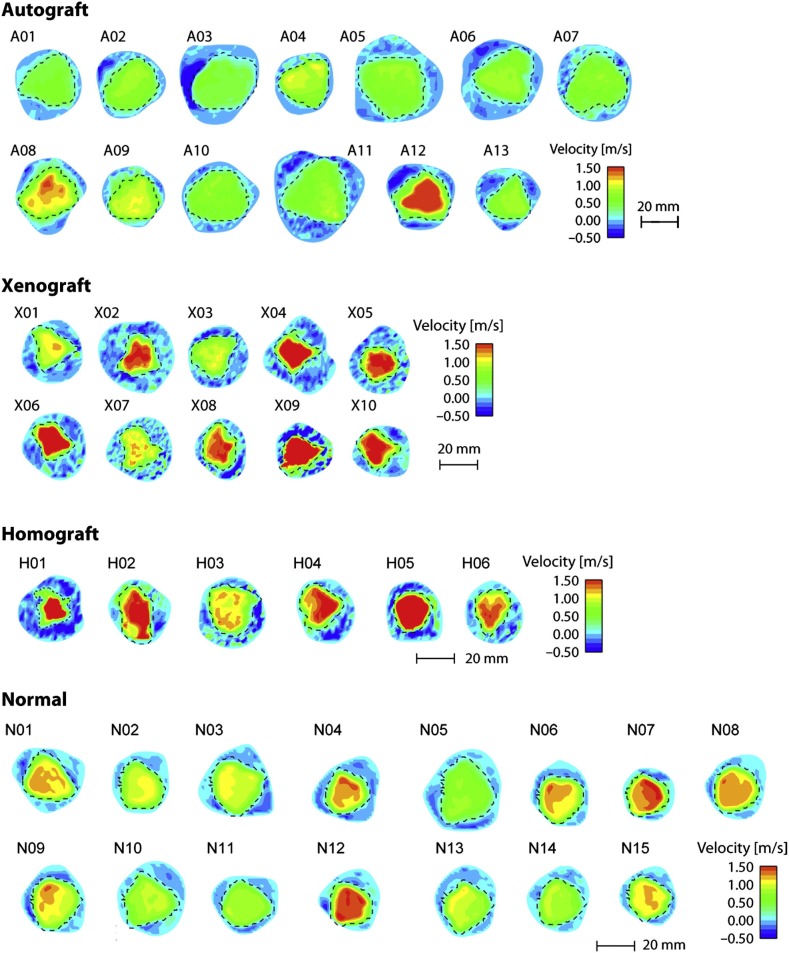
Figure 10.
Effective orifice area. Velocity maps (color contours) and effective orifice areas (broken lines) visualized on cross sections above for autograft, xenograft, homograft native (normal) valve in the aortic position visualised at peak. Images are derived from 2-dimensional cine phase contrast magnetic resonance velocity mapping of valves approximately 10 years after implantation (from Torii et al., 2012). 171

