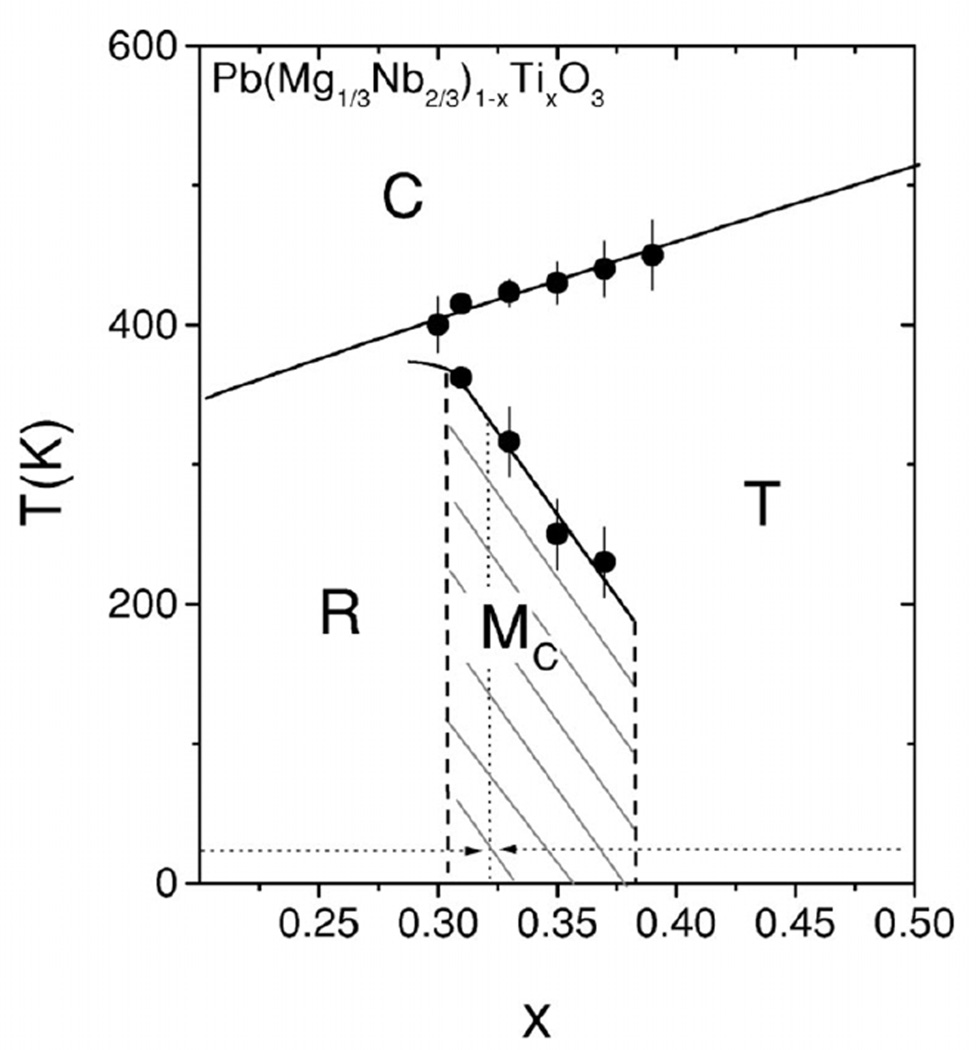
Fig. 9.
The modified phase diagram of PMN-PT single crystals around the MPB [139]. The solid line indicating the transition to the cubic phase is the average of the two temperatures reported by Noblanc et al. [146]. The symbols separating the MC and T phases represent the temperatures at which the MC-T phase transition begins to take place.

