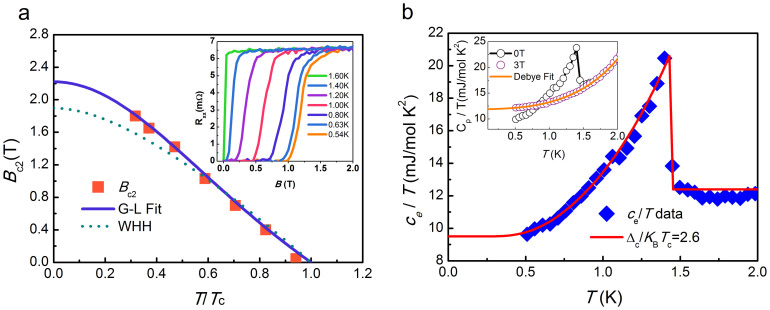
Figure 5. Superconducting properties of LuPdBi single crystal.
(a) The upper critical field Bc2, determined as the vanishing point of the superconducting state (inset), was plotted with the reduced transition temperature t = T/Tc. The blue solid line shows the Ginzburg-Landau (G-L) fit to the data and the dotted green line represents the WHH theoretical curve. Inset: temperature dependence of resistance under different applied magnetic fields. (b) Temperature dependent electronic specific heat ce under zero field after subtracting the phonon contribution based on the Debye fit of the normal state (indicated by the inset). The red solid line represents the calculated ce/T curve given by strong-coupling BCS theory with α = Δ(0)/kBTc = 2.6, Δ(0) = 0.32 meV, Tc = 1.45 K. Inset: cp/T versus T under 0 and 3T magnetic fields. The 3T magnetic field is larger enough to quench superconductivity, therefore the 3T curve represent the normal state of the material.

