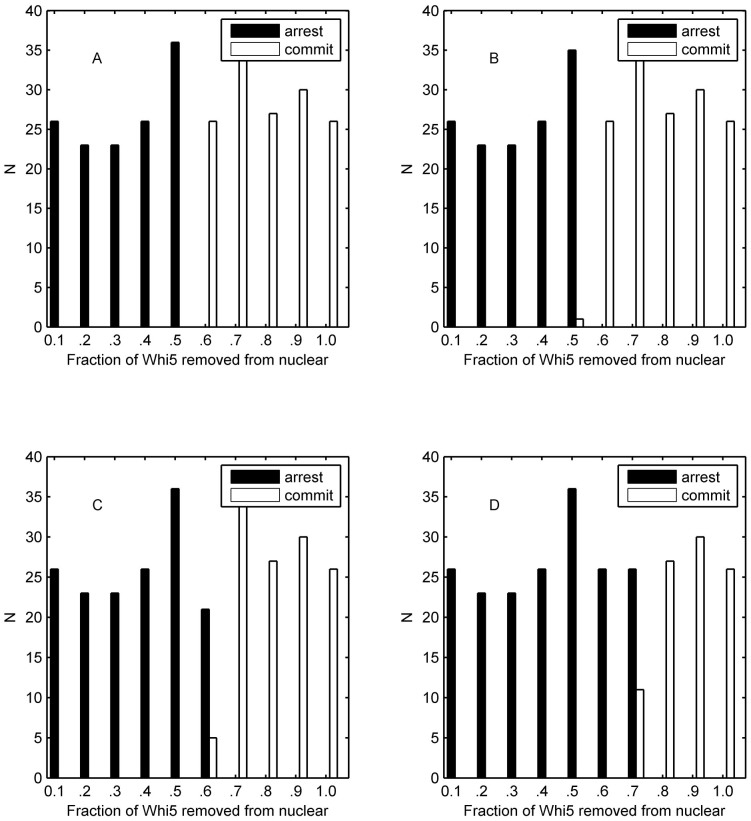
Figure 6. Simulation histograms based on cell fate as determined by the fraction of exported Whi5 at the time of pheromone addition.
The cell fate is distinguished by the impulse of Cln1/2, and extrinsic noise has a standard deviation σ = 0.1. The intrinsic noise has a standard deviation (A)  ≈ 0.01 (V = 10000). (B)
  ≈ 0.0316 (V = 1000). (C)
  ≈ 0.1 (V = 100). (D)
  ≈ 0.3162 (V = 10).

