
Figure 4.
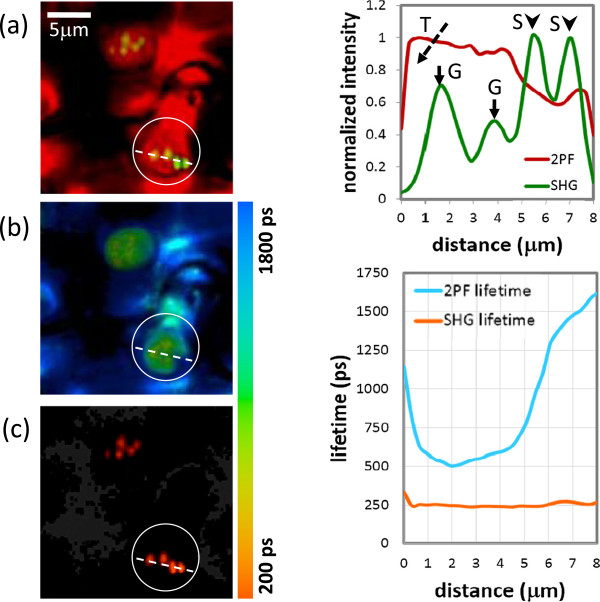
Multiphoton imaging and fluorescence lifetime imaging of 2PF and SHG. The intensity profile and lifetime profile corresponding to the dashed line in the highlighted area are shown in the right-hand side. (a) Merged images of SHG and 2PF signals, similar to those in Figure 3 (b) and (c)In-situ measured 2PF and SHG lifetime imaging, respectively. The color bar shows the corresponding lifetime.